Unit 1 - Basic Economic Concepts
Printable Cheat Sheets for Every Unit
Everything you need to ace your exam, all on a single page.
Download PDF Cheat SheetsTable of Contents
Built into this unit
Flashcards
91 cards mix graphs, formulas, and key terms. Shuffle blends every type so you drill the whole unit—not just one format.
1.1 - Scarcity
Scarcity
Understand the fundamental problem of economics.
Key Terms & Definitions
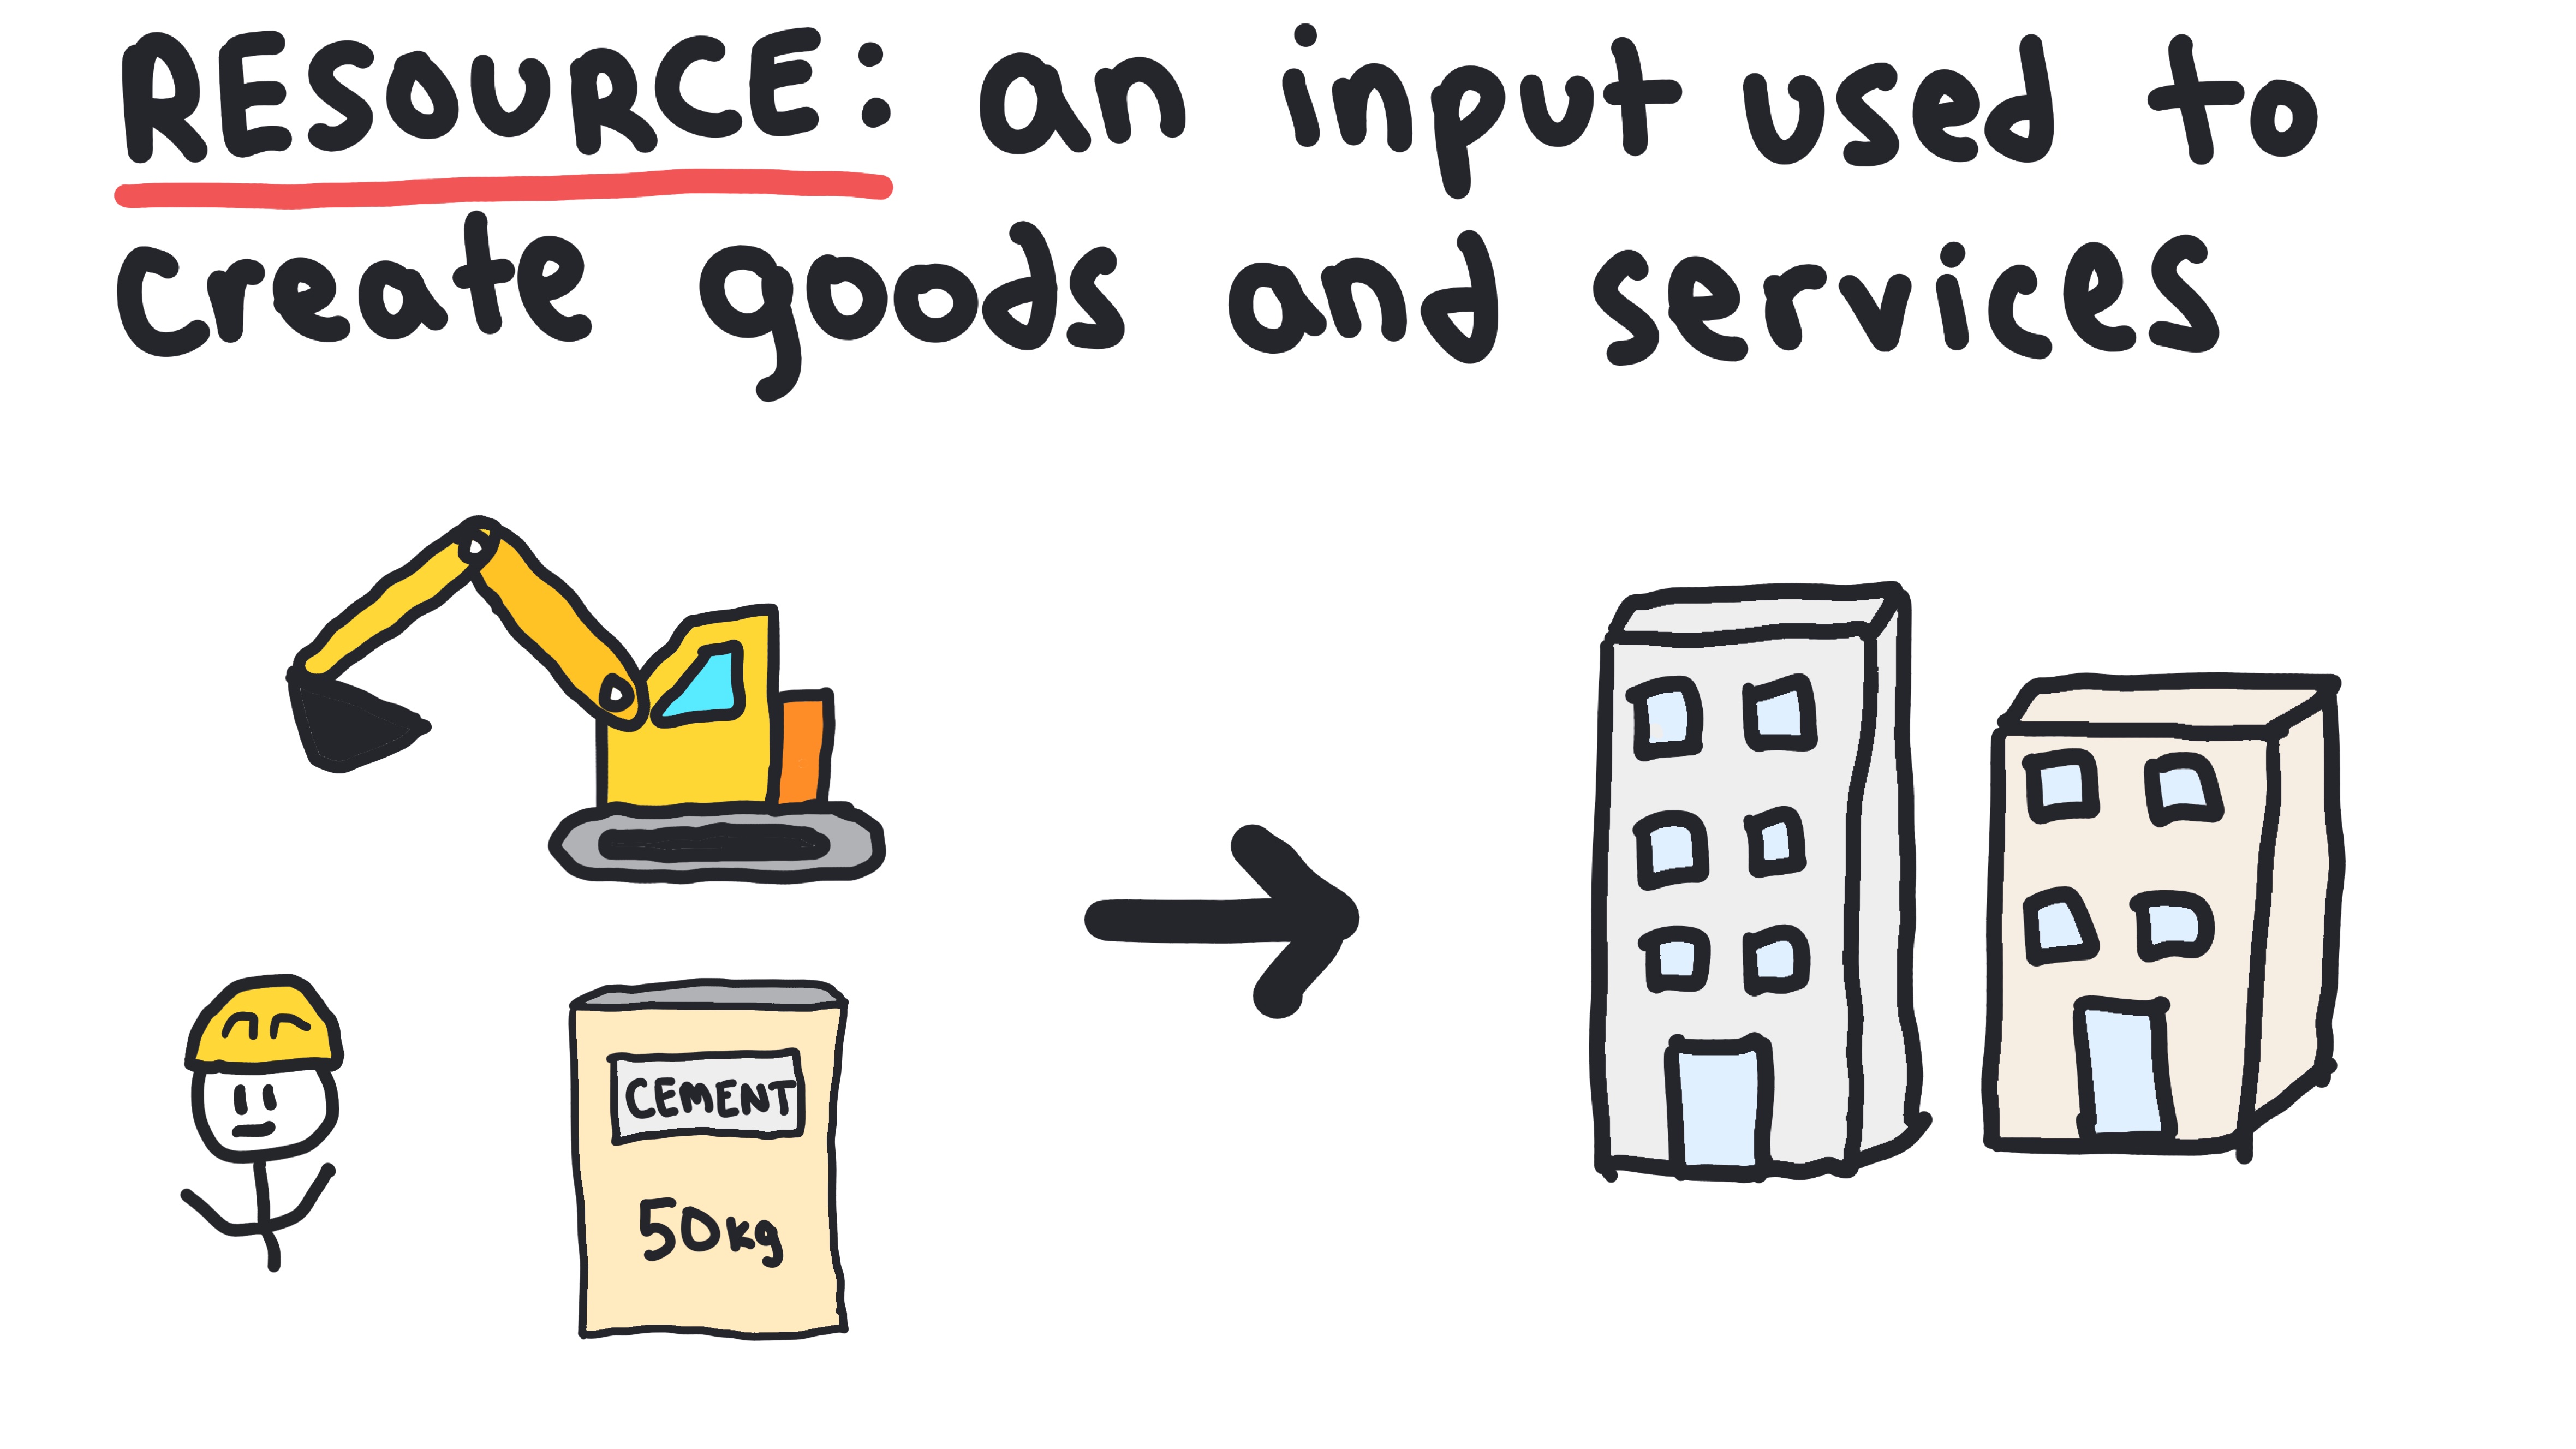
Resources
Inputs used to create goods and services
- •Also known as the factors of production
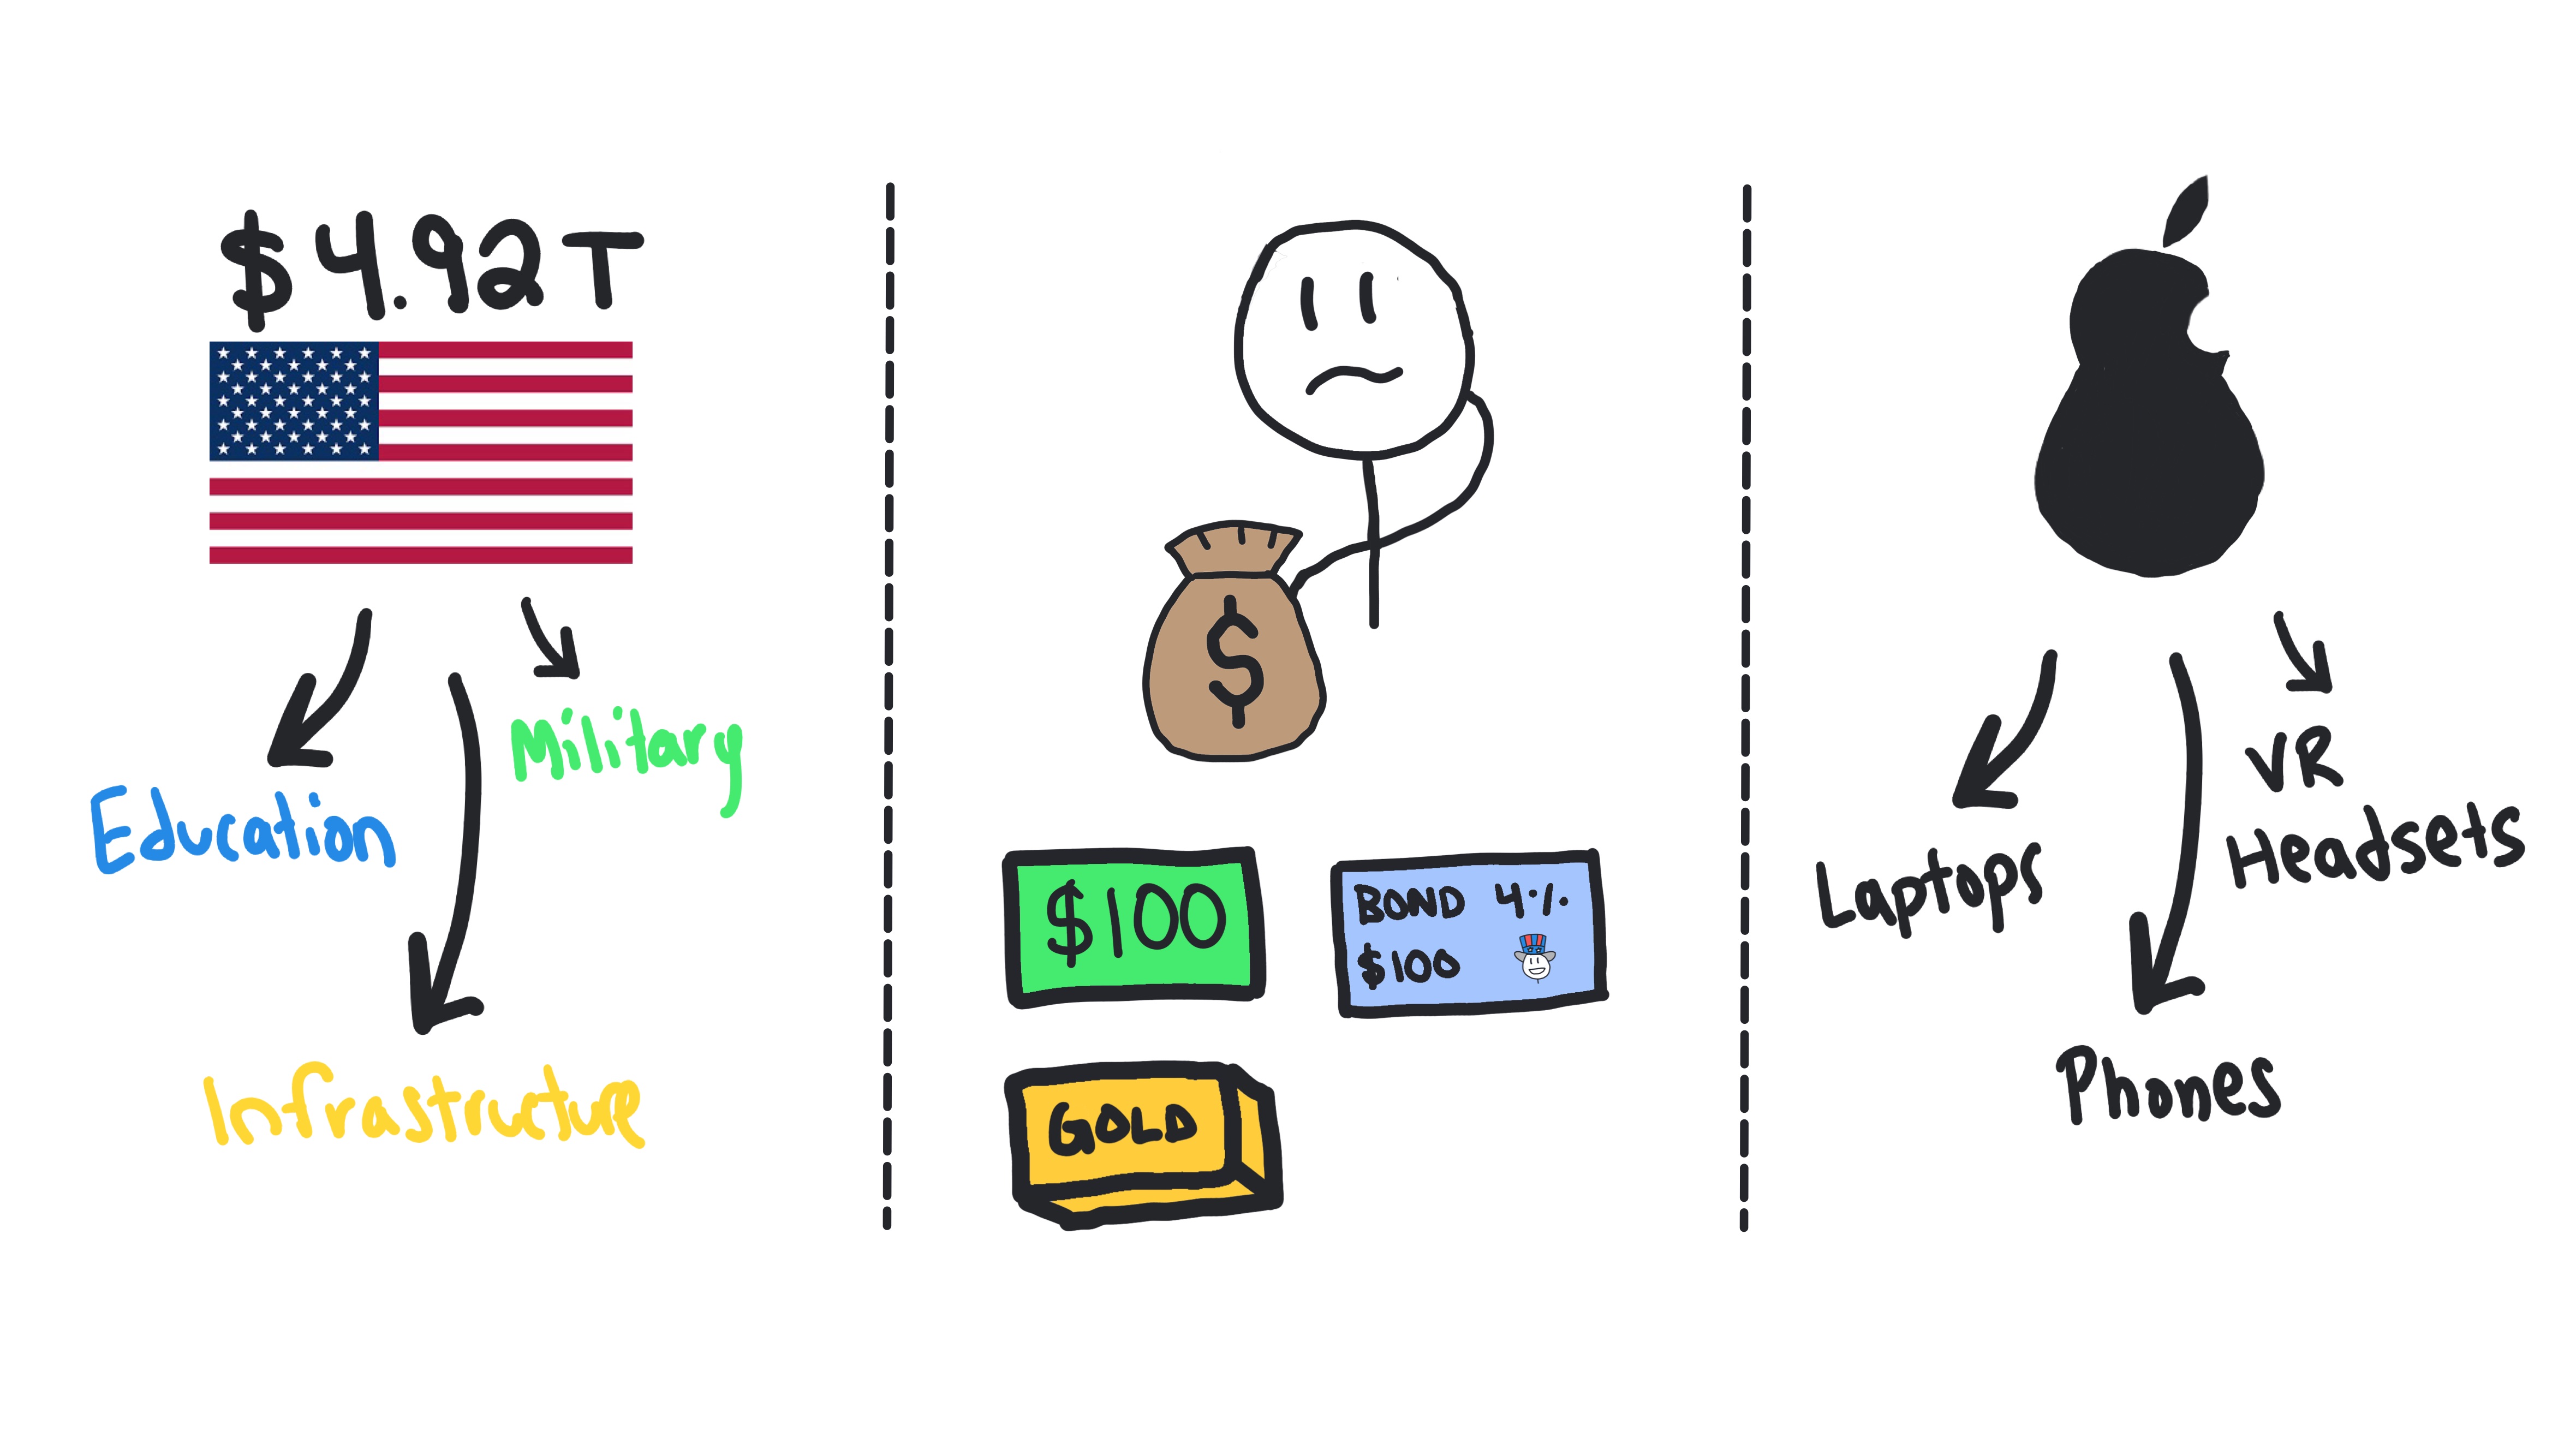
Scarcity
The fundamental problem of economics where there are not enough resources to fulfill all wants and needs.
- •Example (Individuals): A student has limited time and must choose between studying for an exam or going to a party.
- •Example (Businesses): A company has a limited budget and must choose between hiring more employees or investing in new equipment.
- •Example (Countries): A nation has limited oil reserves and must decide how to allocate them between domestic use and exports.
Macroeconomics
The study of how entire countries face the issue of scarcity.
- •Example: Might study how an increase in taxes impacts consumer spending.
Microeconomics
The study of how individuals and companies face the issue of scarcity.
- •Example: Might study how a company decides how many workers to hire, or how much to produce.
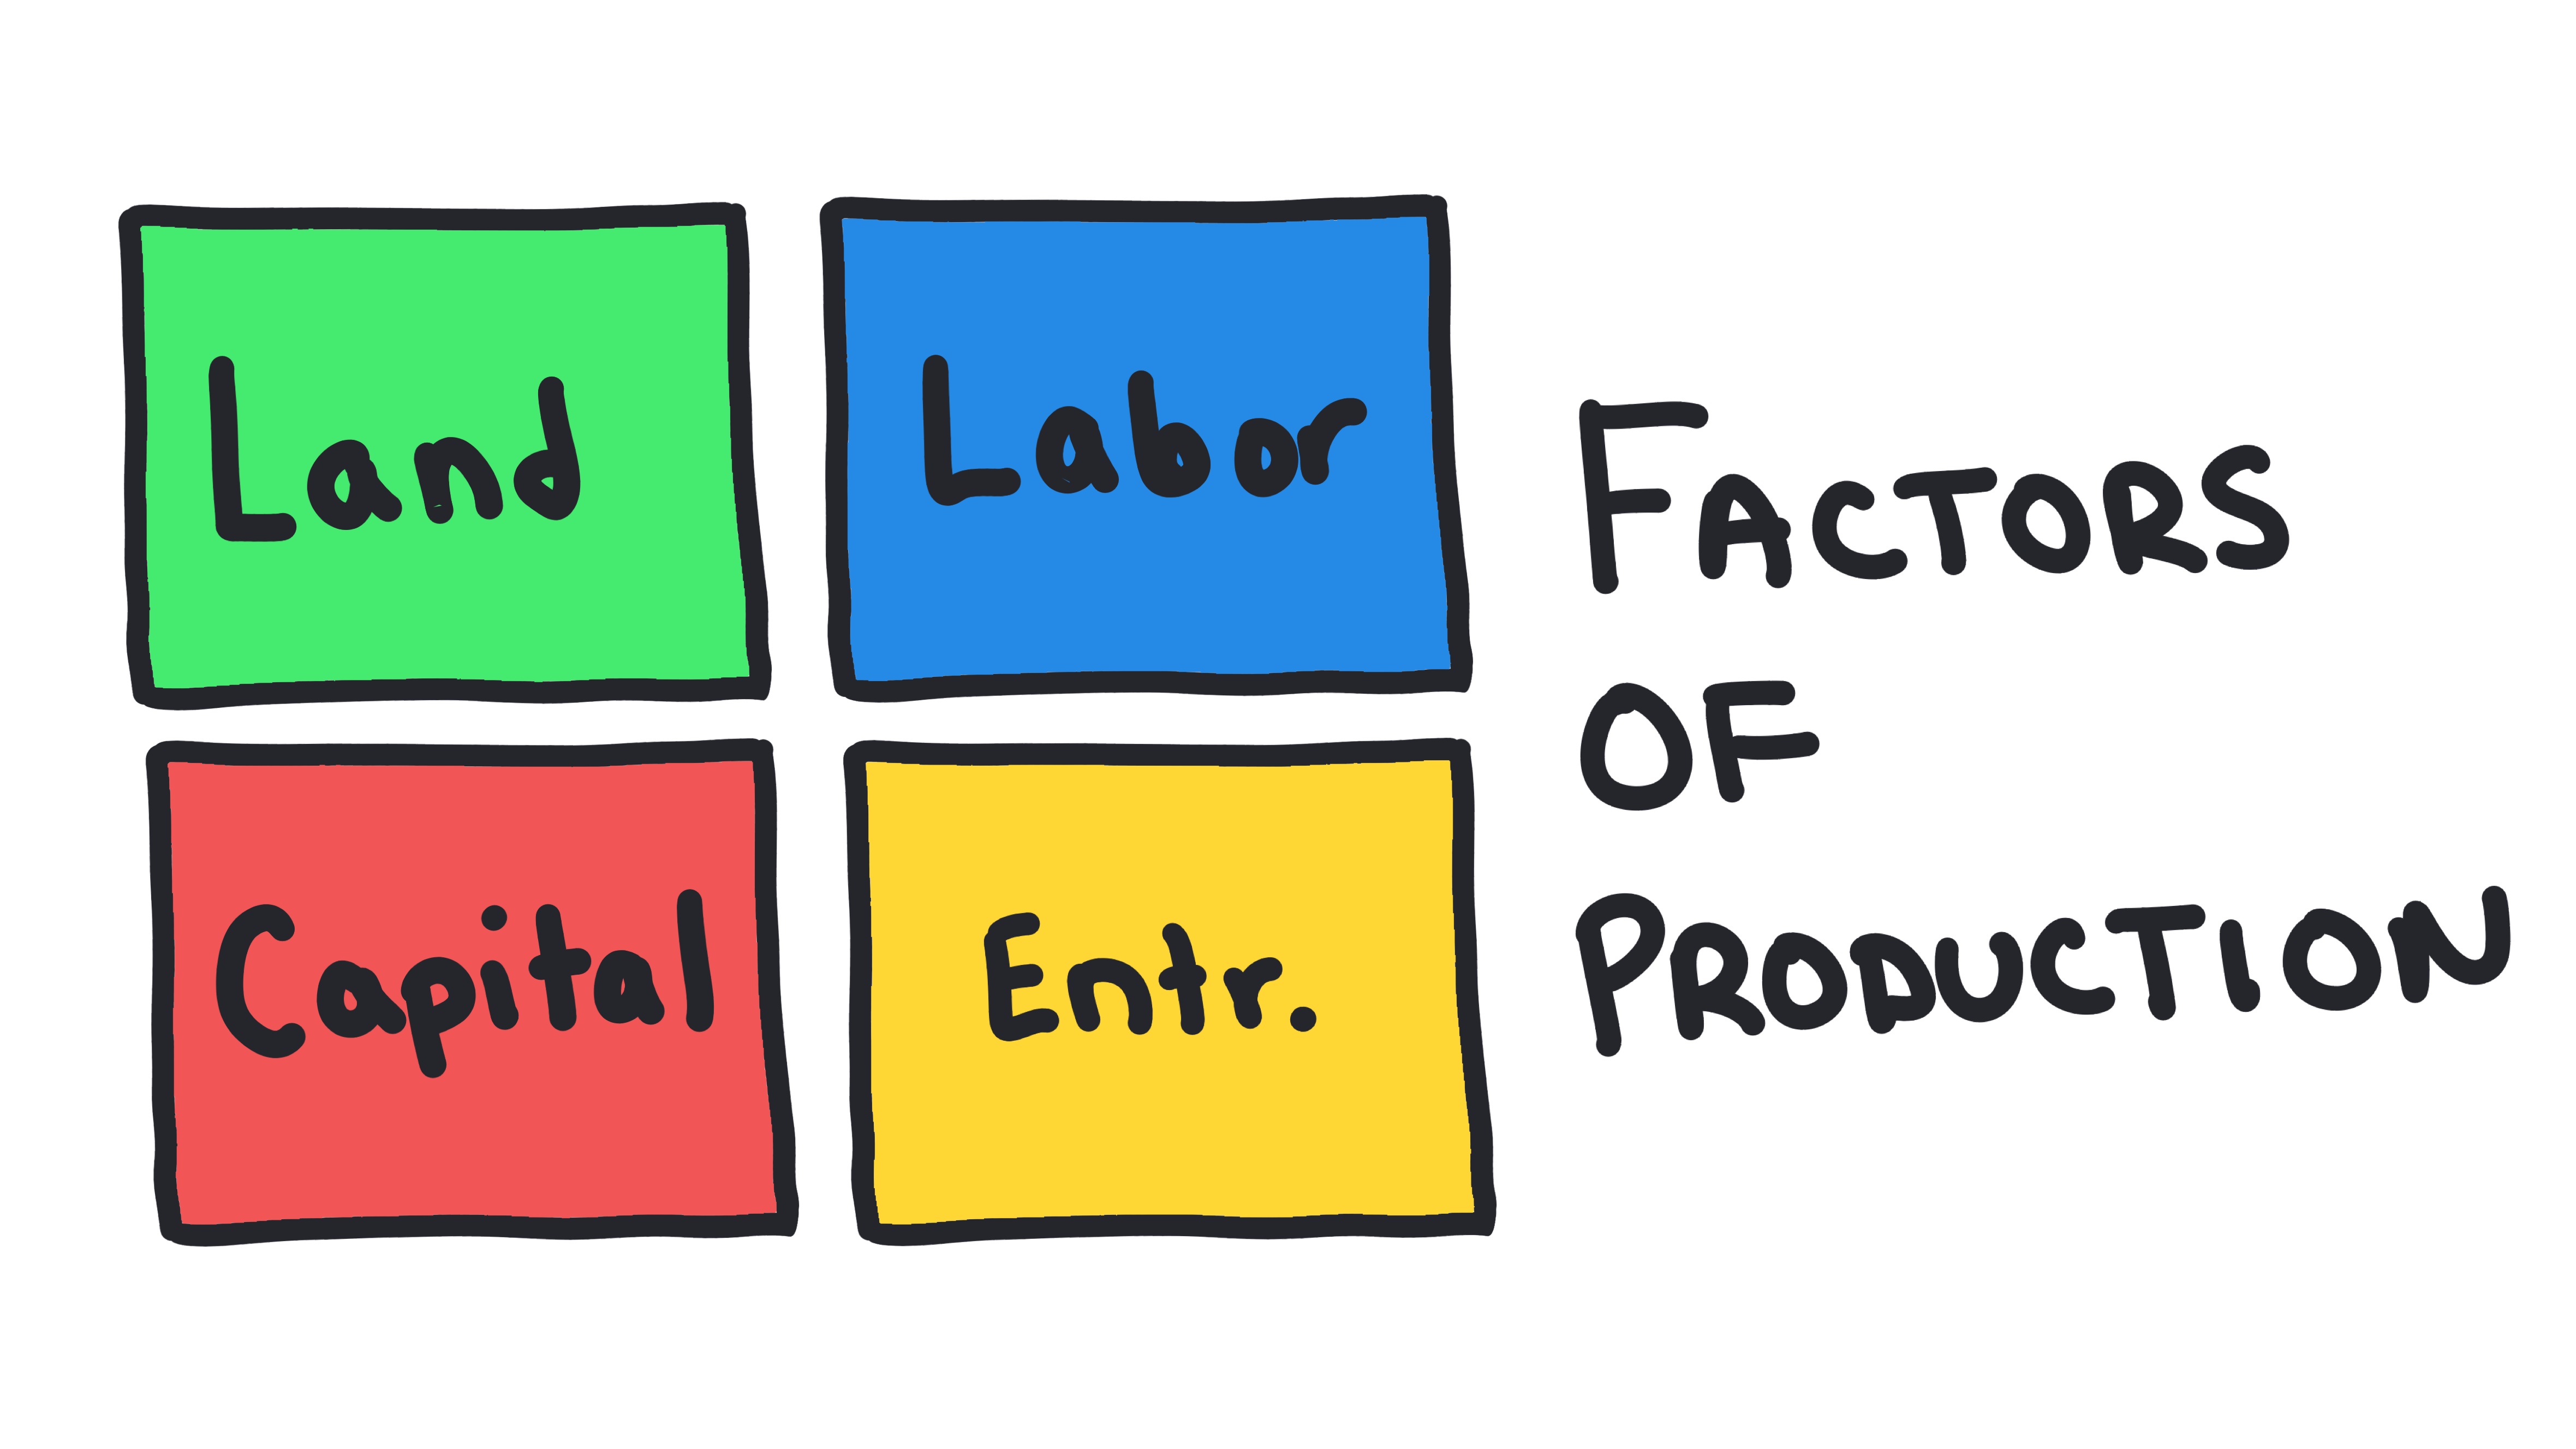
Factors of Production
The resources used to produce all goods and services.
- •Land
- •Labor
- •Capital
- •Entrepreneurship
Land
All natural resources used in production.
- •Example: Farmland used to grow crops, or minerals used to build electronics.
Labor
The human effort and skills used in production.
- •Example: The work done by a chef in a restaurant or an engineer at a tech company.
Capital
Human-made resources used to create other goods and services.
- •Example: A factory building used to manufacture cars, or a computer used to design software.
Physical Capital
The tools, machinery, and buildings used in production.
- •Example: A tractor used on a farm, a delivery truck for a shipping company, or a factory building.
Human Capital
The knowledge and skills a worker gains through education and experience.
- •Example: A doctor's medical training, a programmer's coding skills, or a chef's culinary expertise.
Entrepreneurship
The ability to combine the other factors of production to create goods and services, often involving risk-taking.
- •Example: A business owner who starts a new restaurant, combining land (location), labor (chefs and servers), and capital (kitchen equipment) to create a dining experience.
Whiteboards
Practice MCQs
Test your understanding of 1.1
The fundamental problem of economics that arises from limited resources and unlimited wants is known as:
1.2 - Opportunity Cost and the Production Possibilities Curve (PPC)
Opportunity Cost and the Production Possibilities Curve
Learn about opportunity cost, the production possibilities curve, and the concept of trade-offs.
Key Terms & Definitions
Trade-off
Giving up one thing to get another due to scarcity.
Opportunity Cost
The value of the next best alternative given up when making a choice.
- •Example: If a country can produce 10 units of Good A or 5 units of Good B with the same resources, the opportunity cost of producing 1 unit of Good A is 0.5 units of Good B (5 ÷ 10 = 0.5).
- •Example: If I can finish two math assignments in an hour and one English assignment in an hour, then my opportunity cost of doing the English assignment is 2 math assignments.
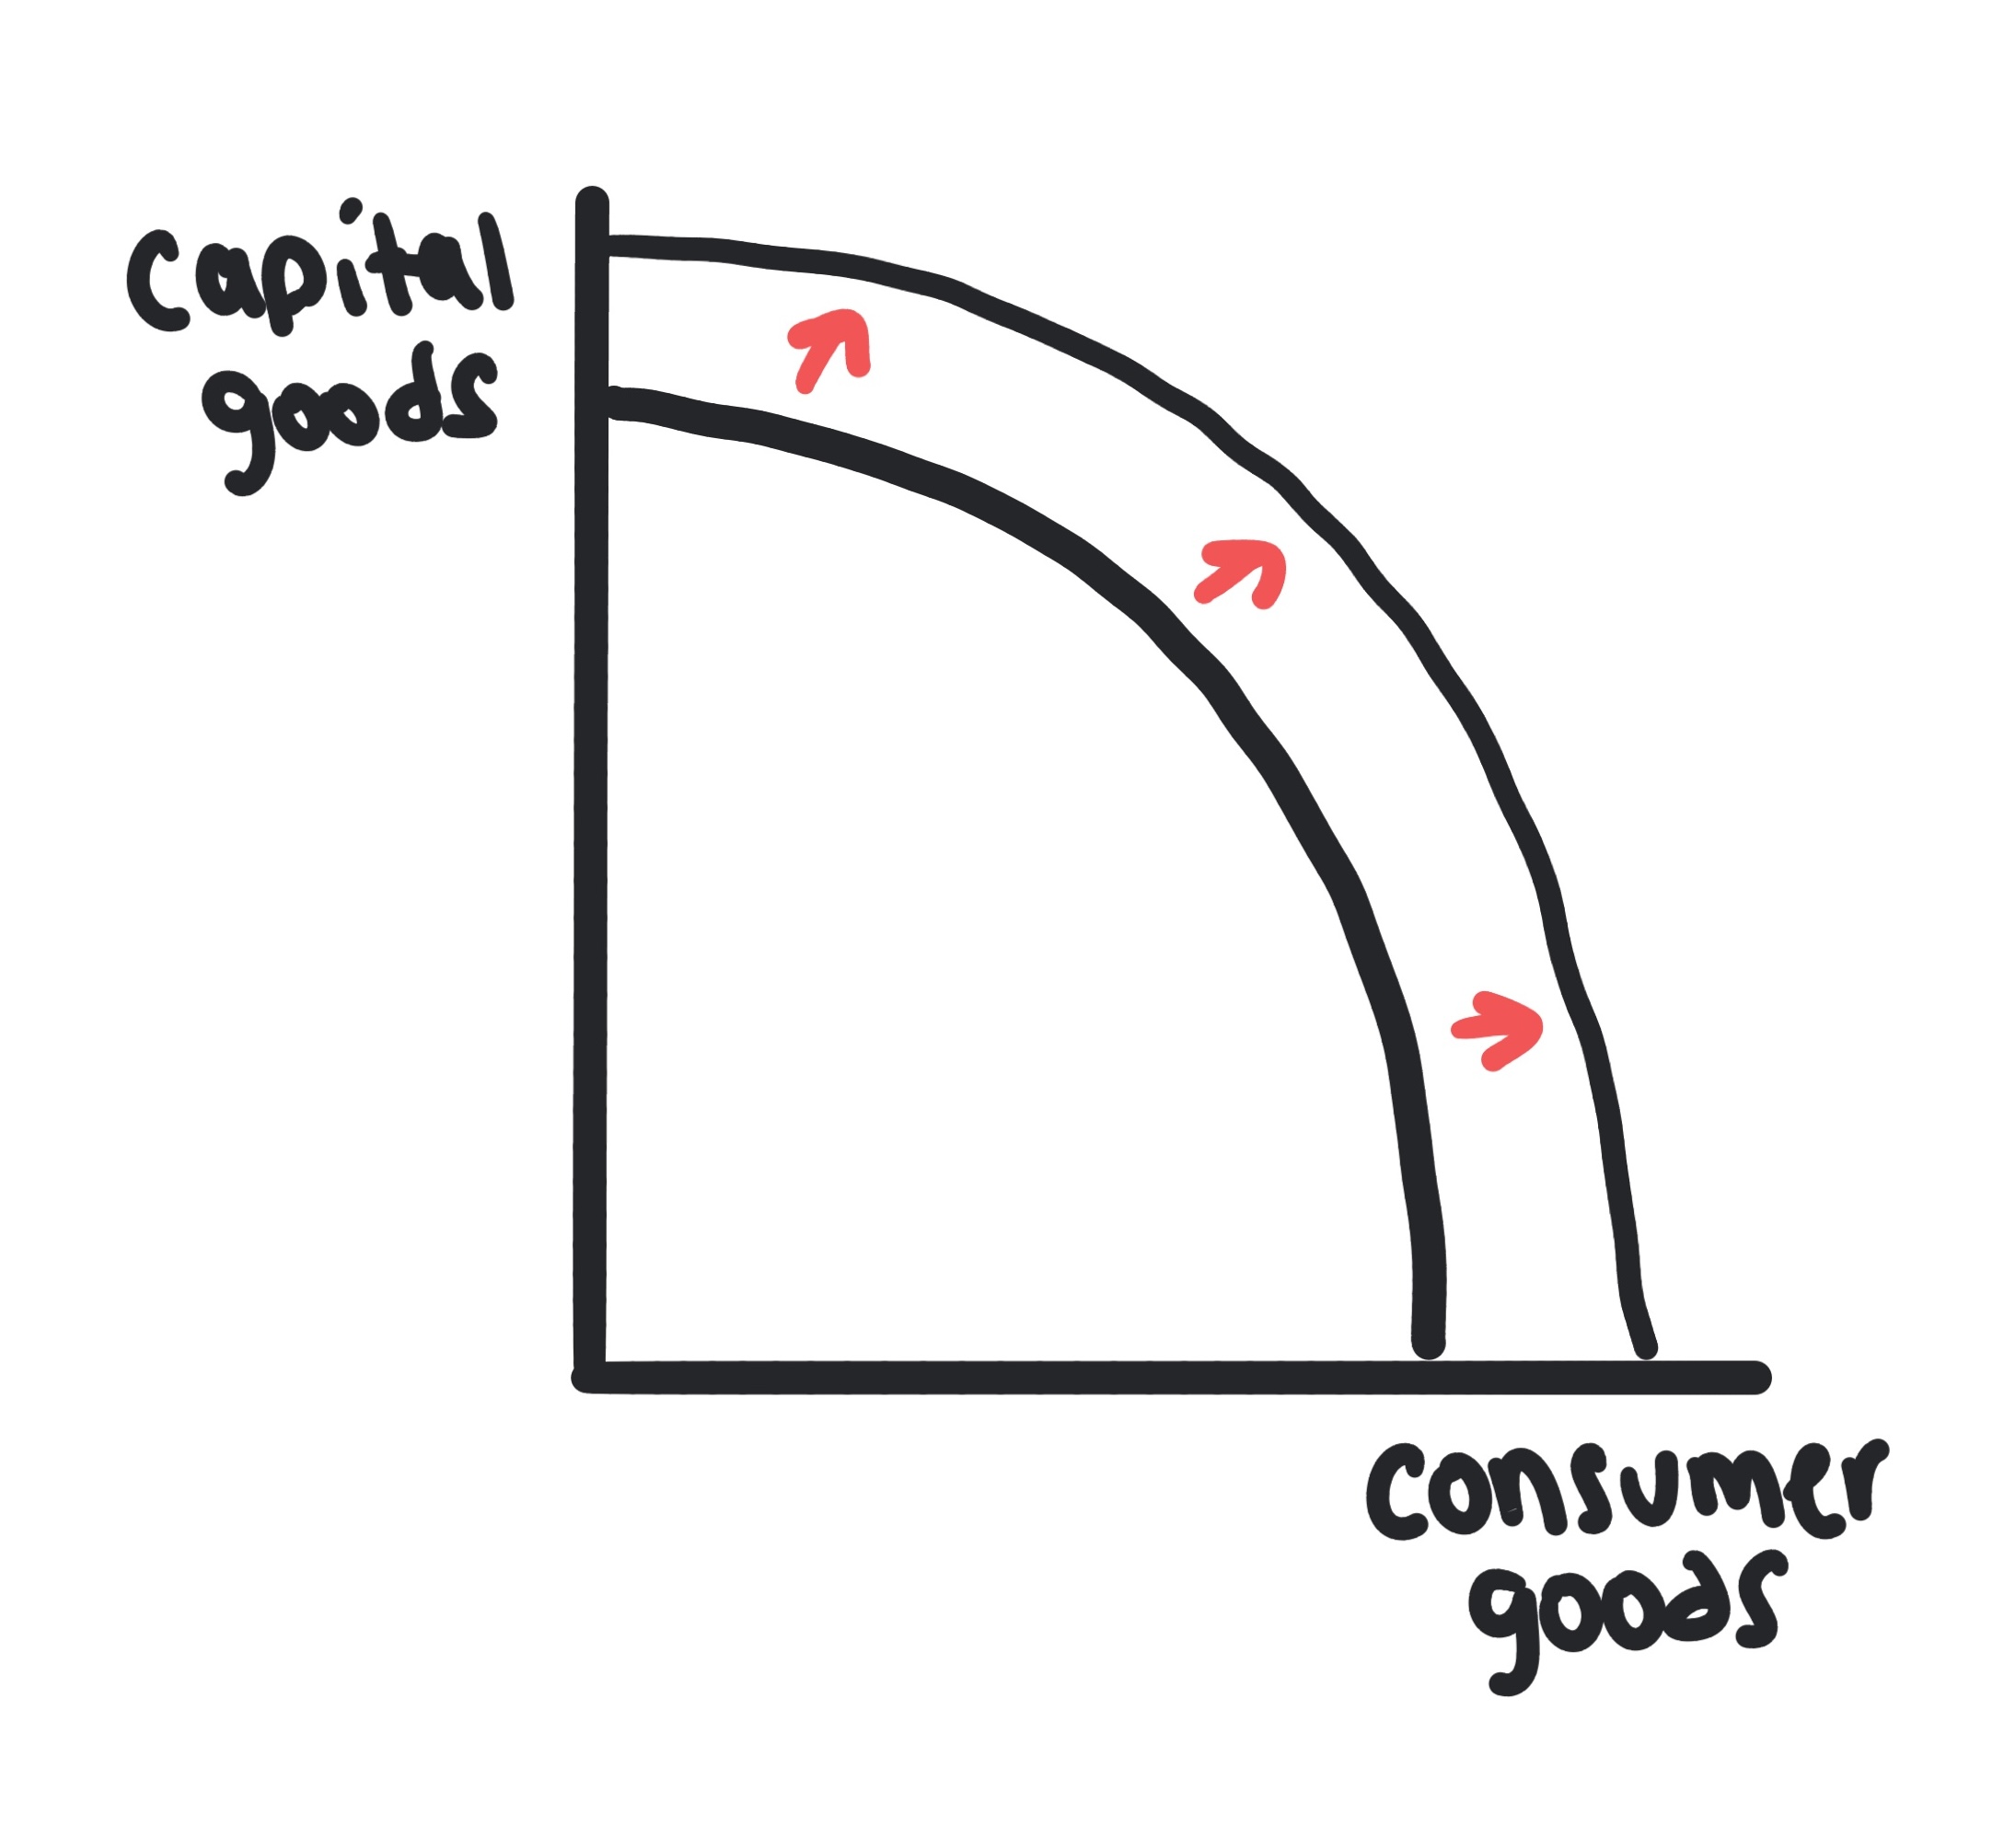
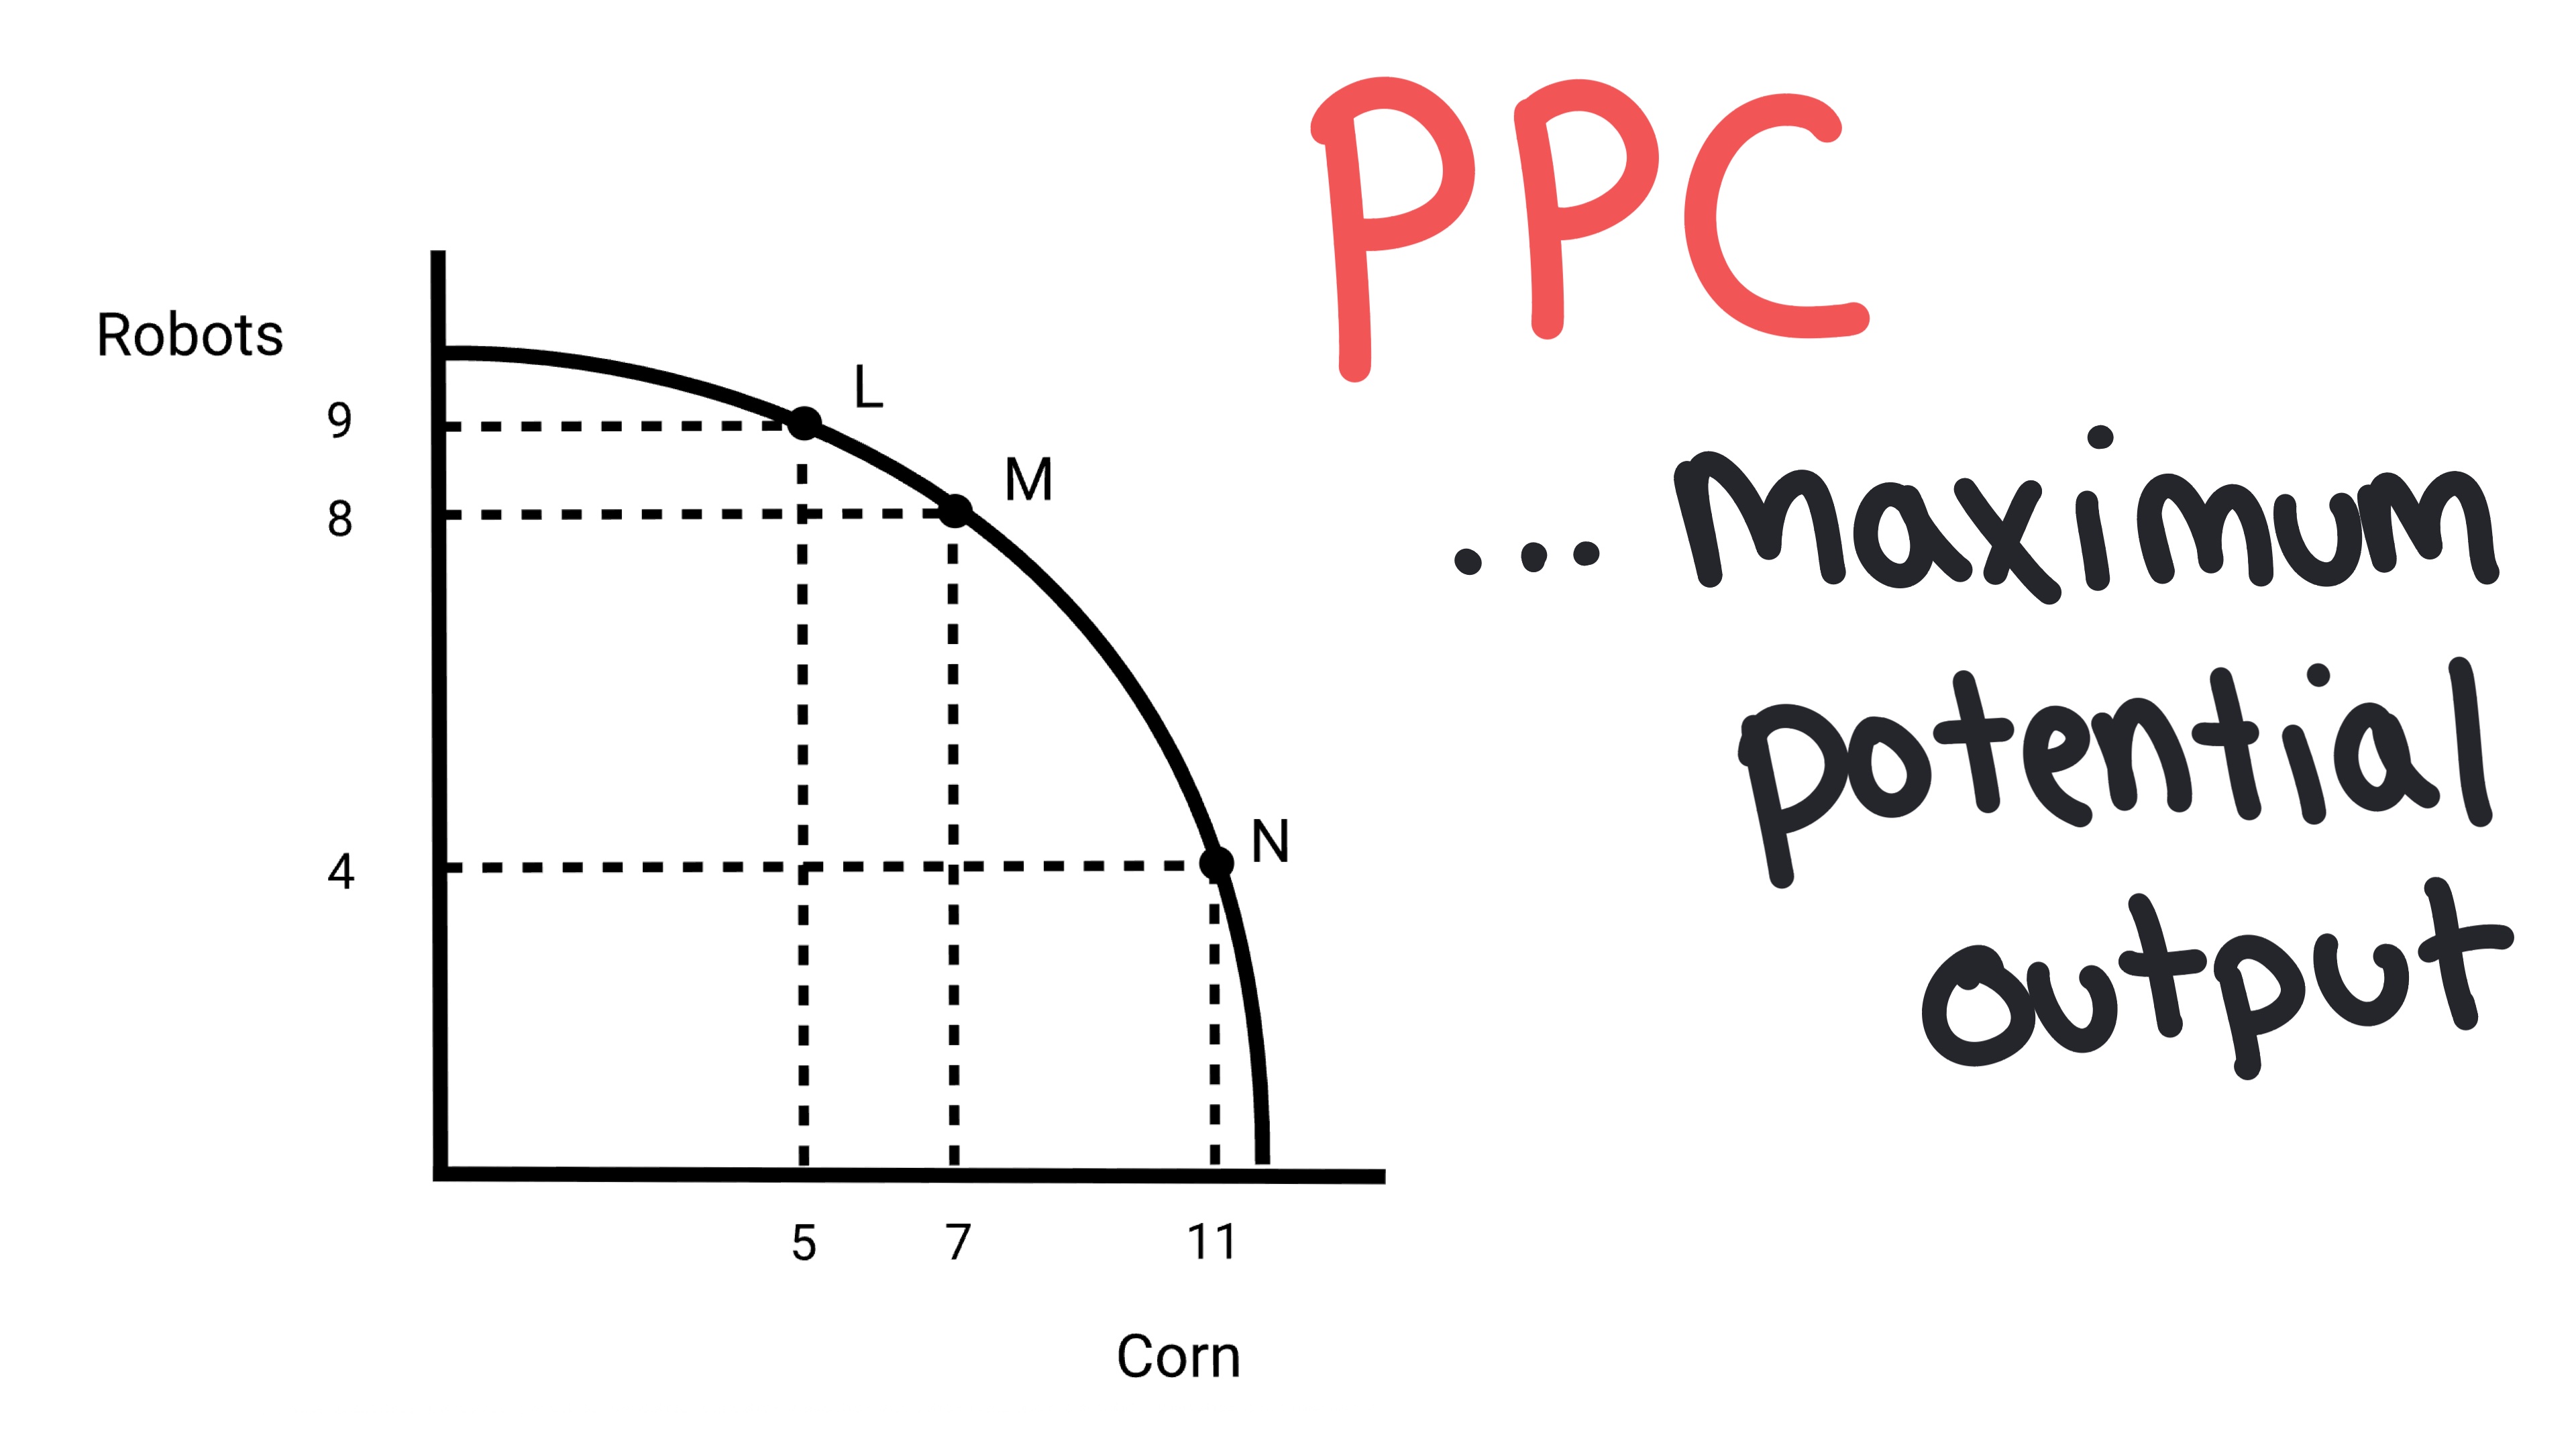
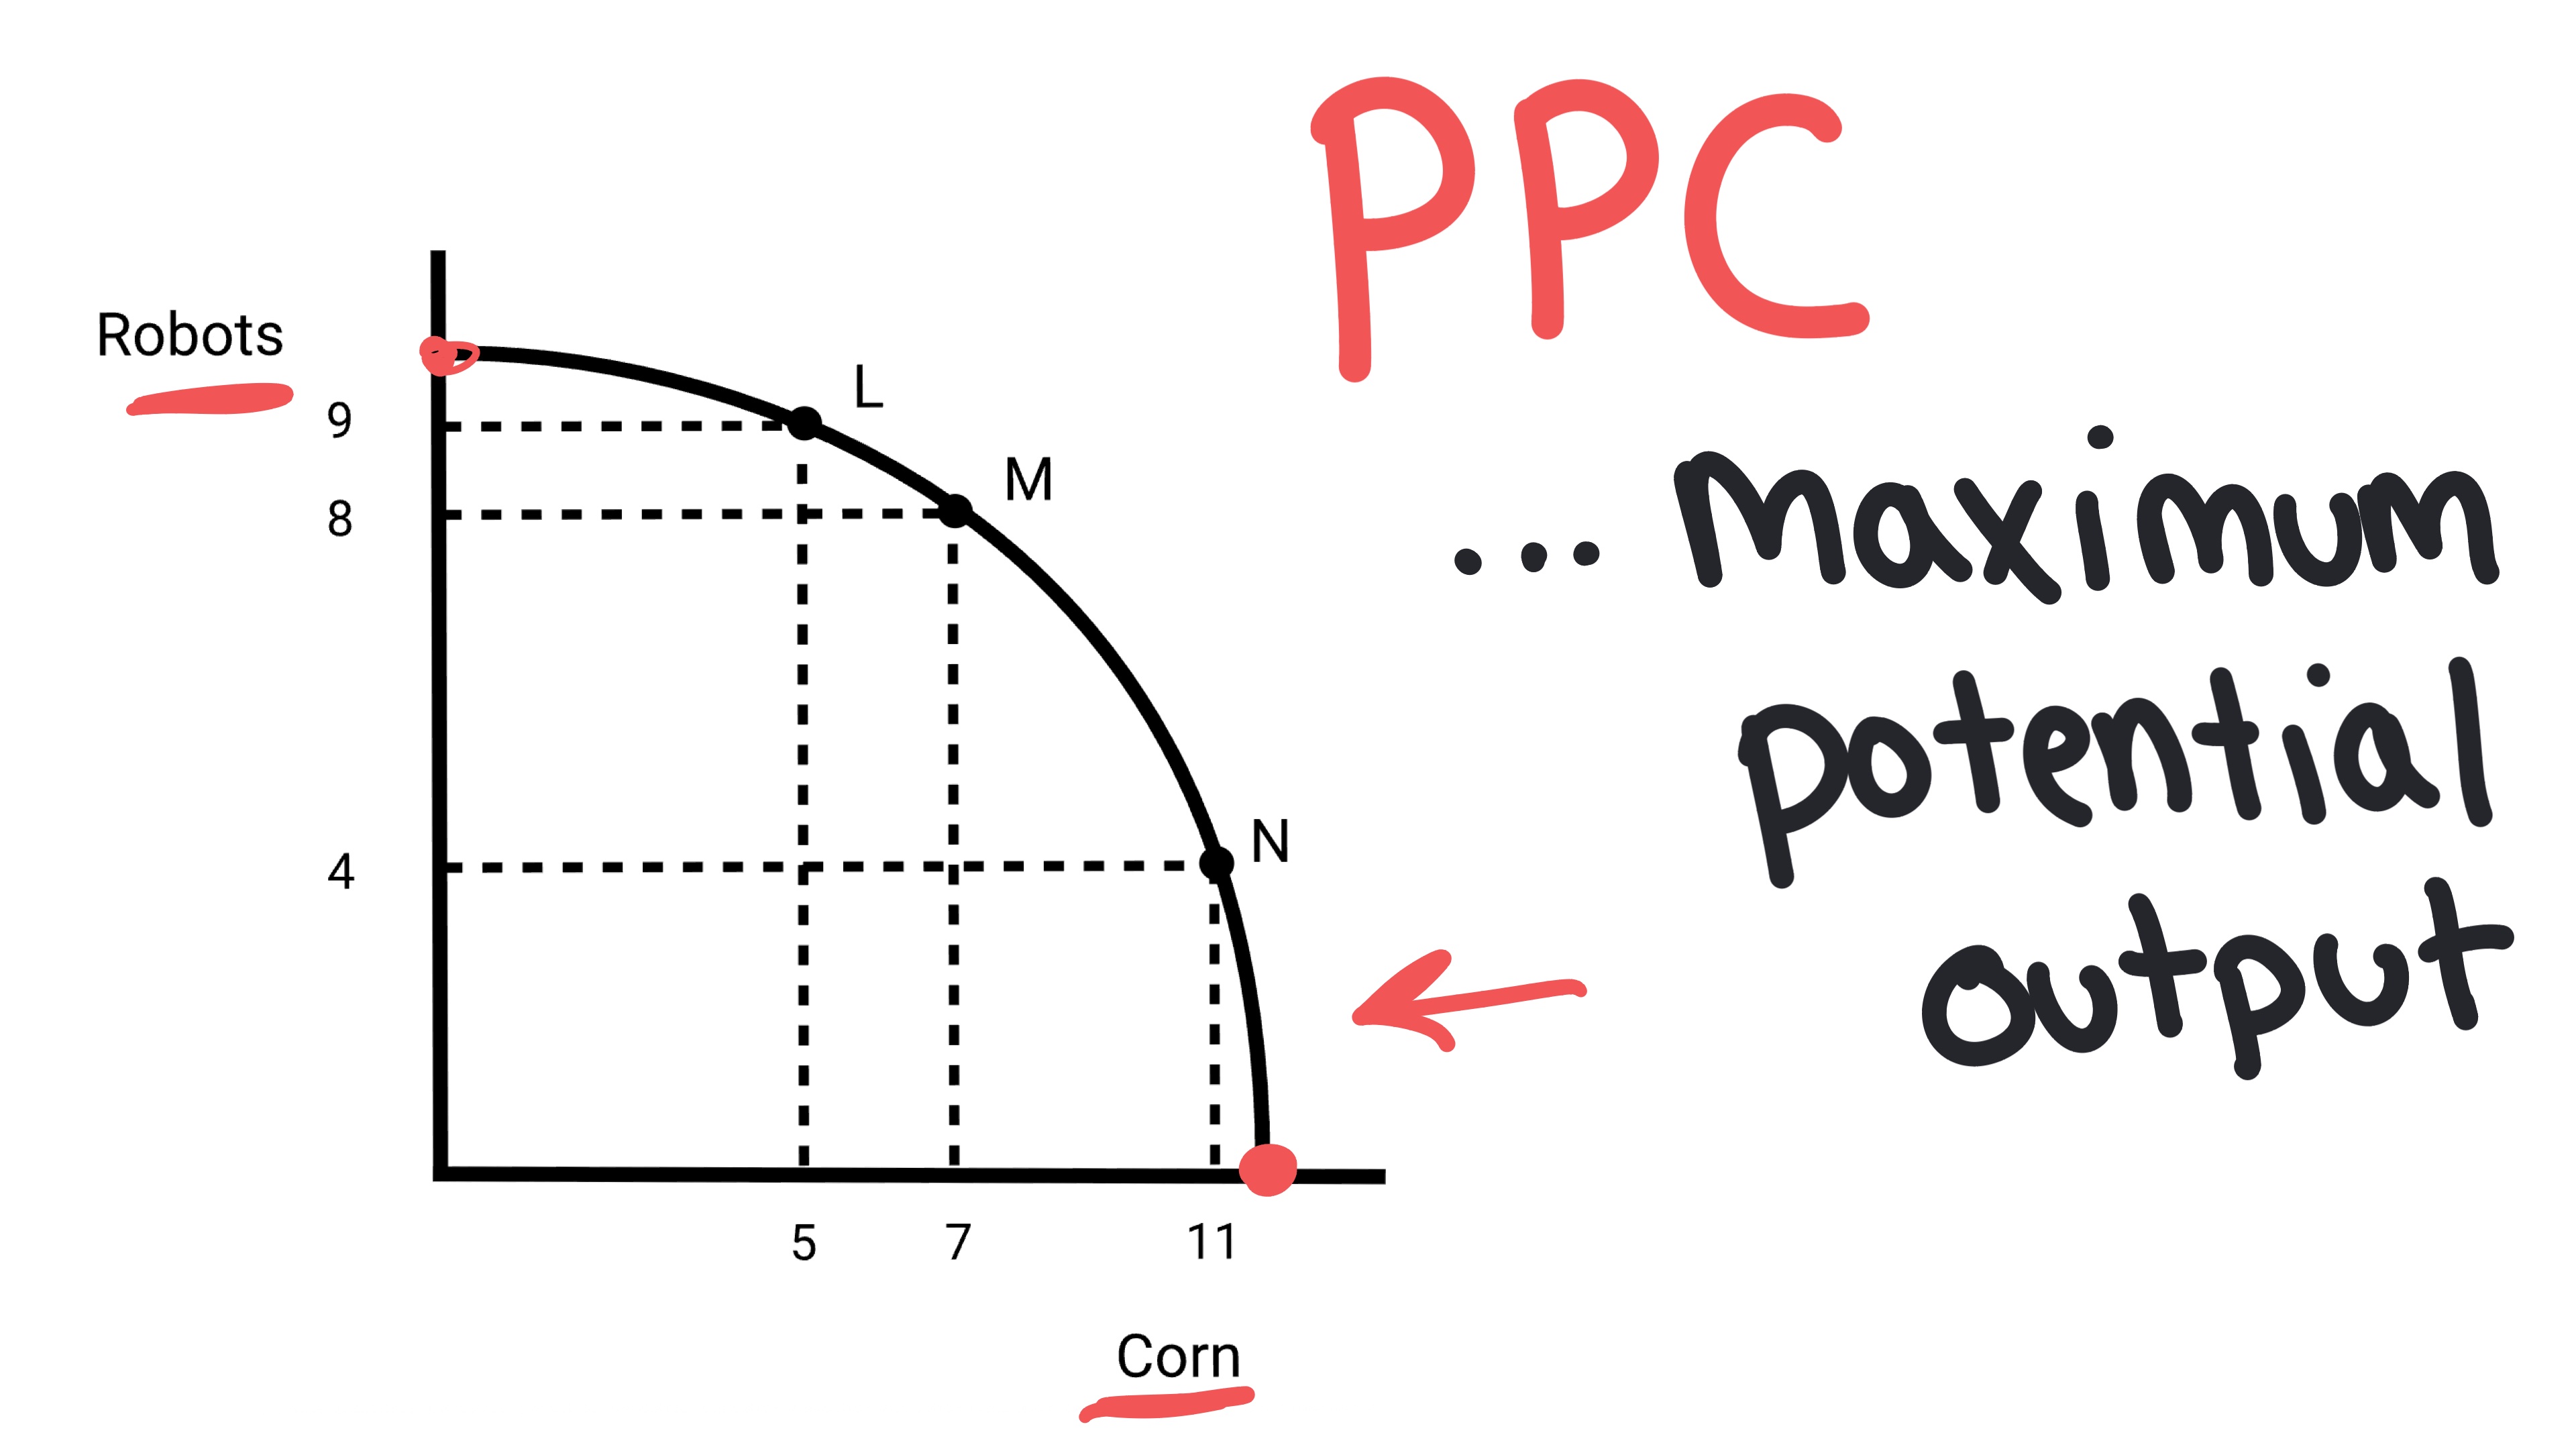
Production Possibilities Curve (PPC)
A graph showing different combinations of two goods that can be produced using all resources efficiently.
- •Points on the curve = efficient use of resources
- •Points inside = inefficient use
- •Points beyond = unattainable
Constant Opportunity Cost
When the opportunity cost of producing a good remains the same, shown by a straight-line PPC.
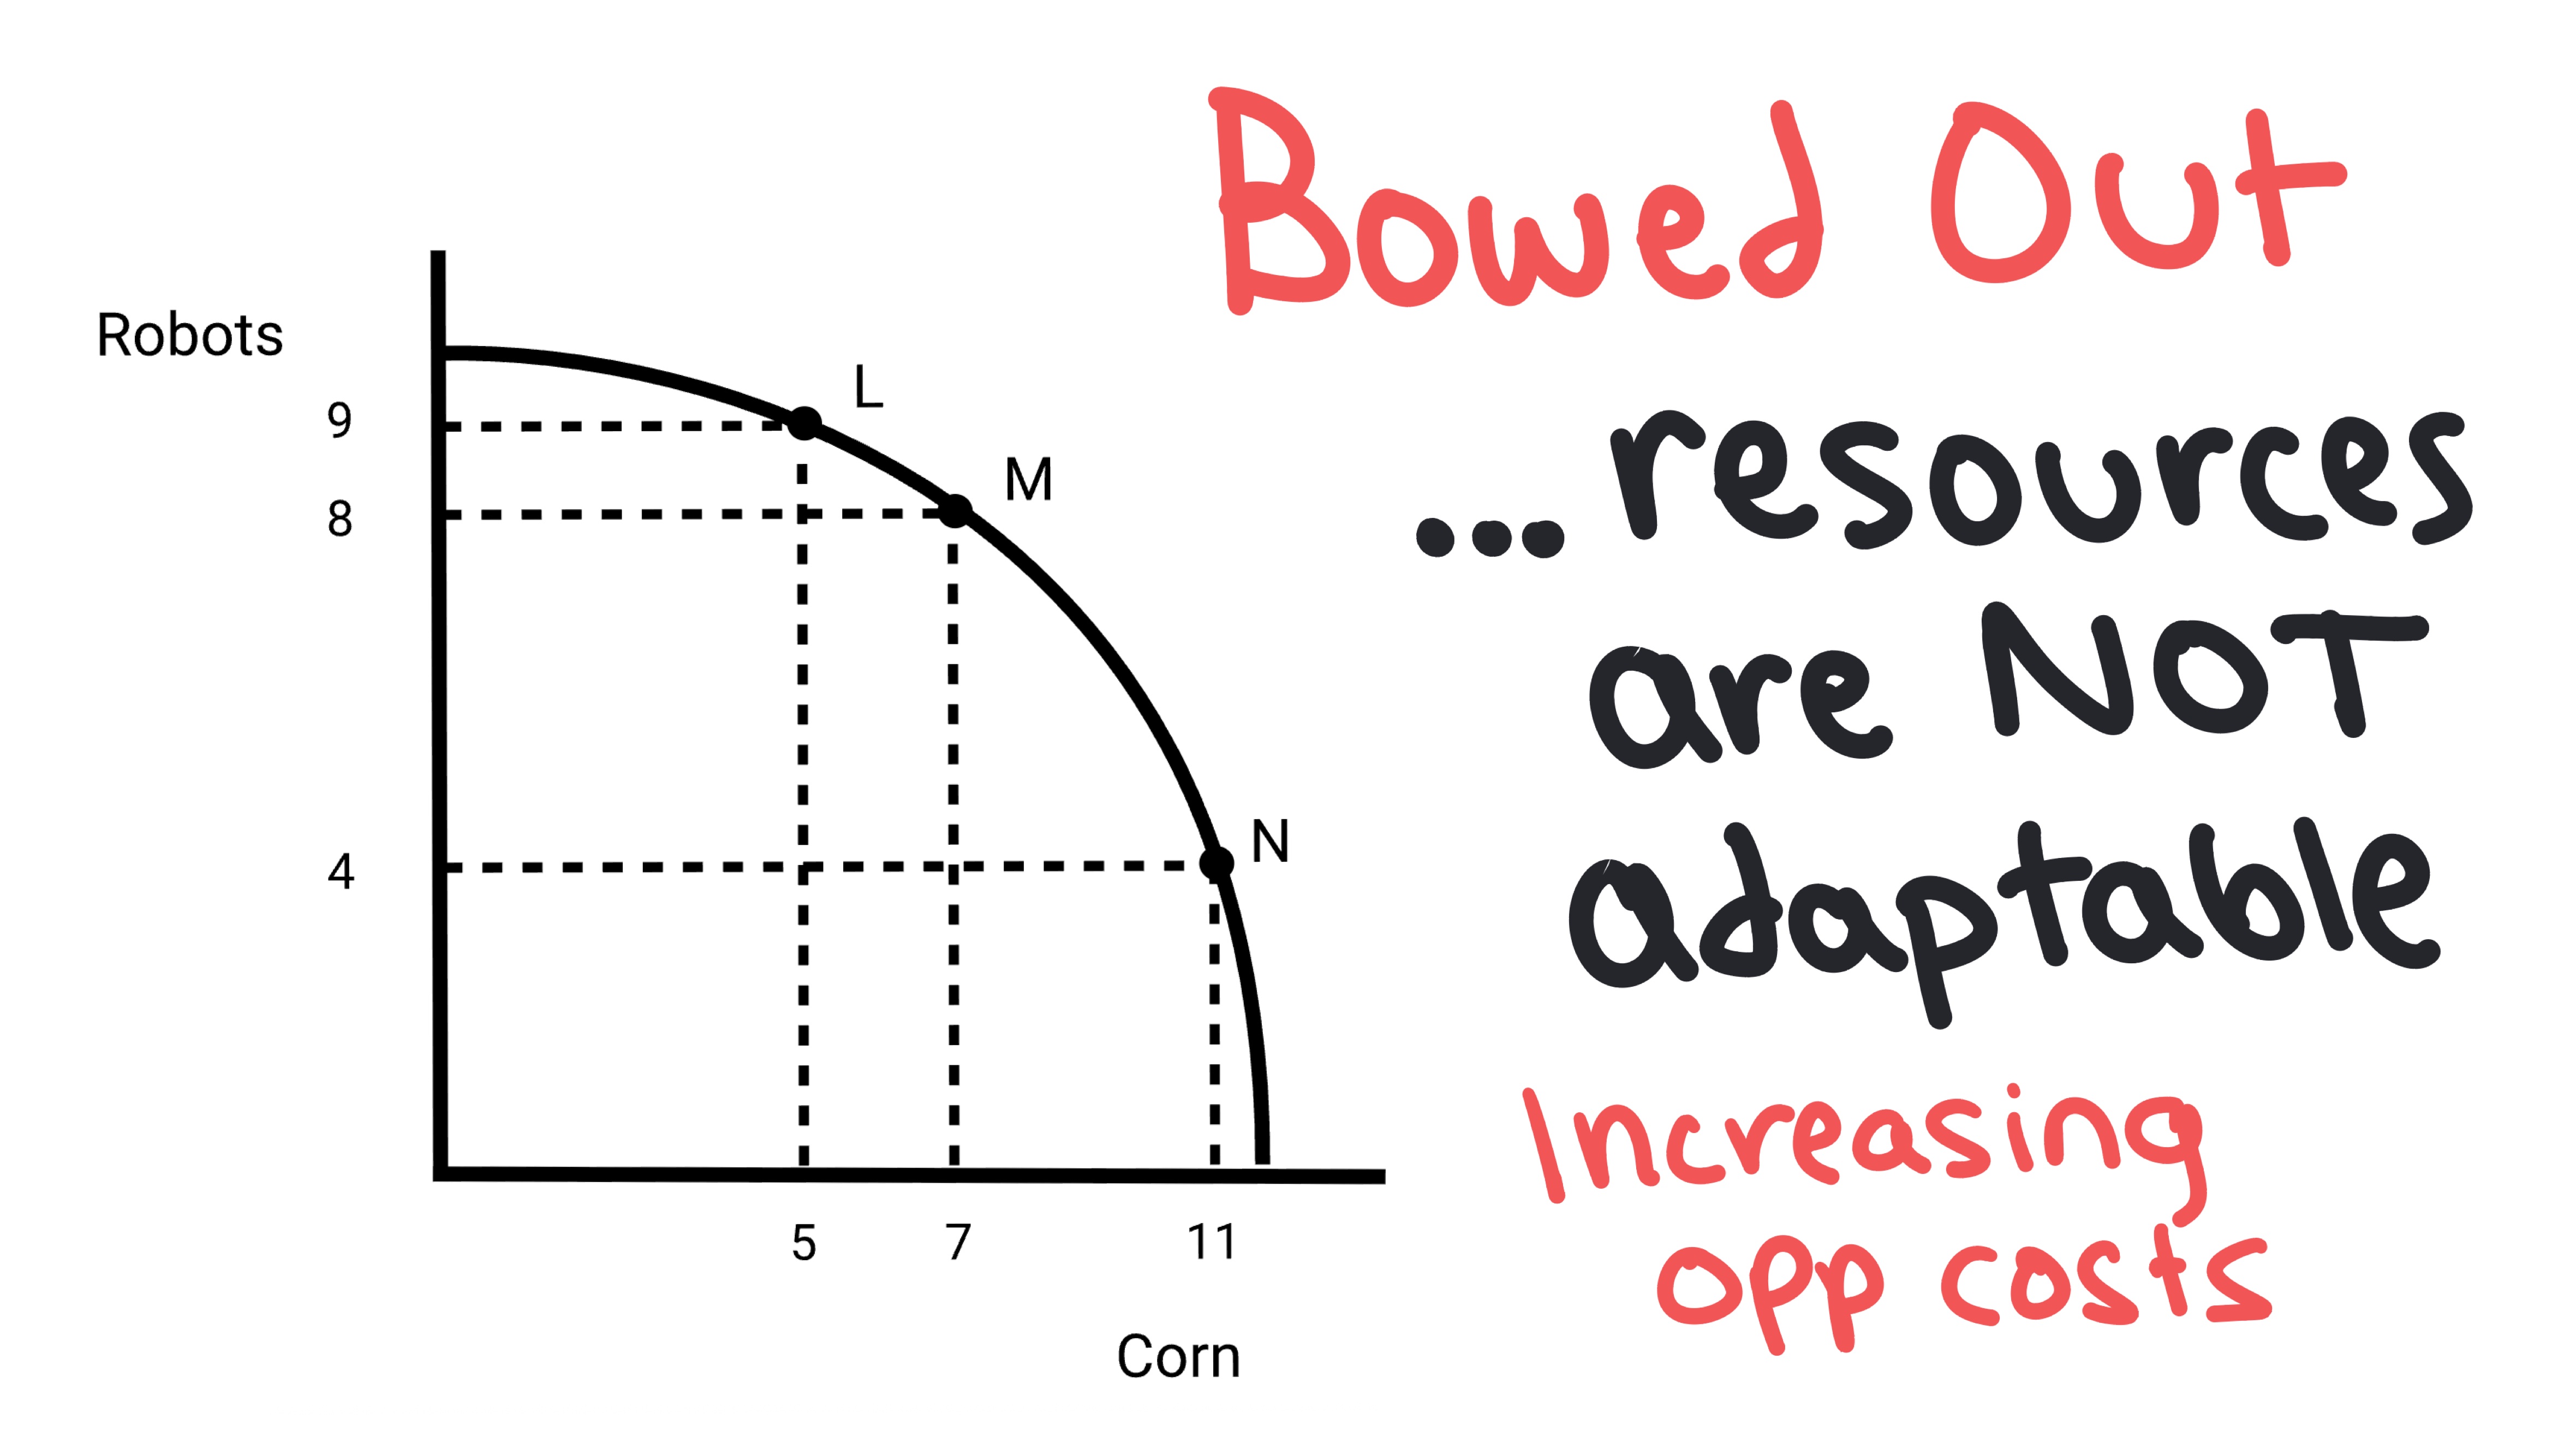
Increasing Opportunity Cost
When the opportunity cost of making a good increases the more of it you produce, shown by a bowed-out PPC.
Underutilization
A situation where an economy is not using all of its resources efficiently, producing less than its maximum potential output.
- •Where to find on a graph: Points located inside the PPC curve represent underutilization.
- •Example: If a country has high unemployment, it is operating at a point inside its PPC, not using all available labor resources.
Allocative Efficiency
A situation where resources are allocated to produce the combination of goods and services that society most values.
- •Where to find on a graph: The specific point on the PPC curve that represents the optimal combination of goods based on society's preferences.
- •Note: While all points on the PPC are productively efficient, only one point represents allocative efficiency (the point that matches what society wants most).
Unattainable Point
A combination of goods that cannot be produced with the current resources and technology available to an economy.
- •Where to find on a graph: Points located outside (to the right of) the PPC curve represent unattainable combinations.
- •Example: If a country wants to produce more of both goods than its PPC allows, that combination is unattainable with current resources.
Outward Shift (PPC)
Represents economic growth caused by an increase in quantity/quality of resources or improved technology.
Inward Shift (PPC)
Represents loss of productive capacity due to events like disasters or war.
Whiteboards
Practice MCQs
Test your understanding of 1.2
The value of the best alternative forgone when a choice is made is called:
1.3 - Comparative Advantage and Gains from Trade
Comparative Advantage Practice: Output Questions
Learn how to identify and solve output comparative advantage questions
Key Terms & Definitions
Absolute Advantage
The ability to produce more of a good than another producer, given the same resources.
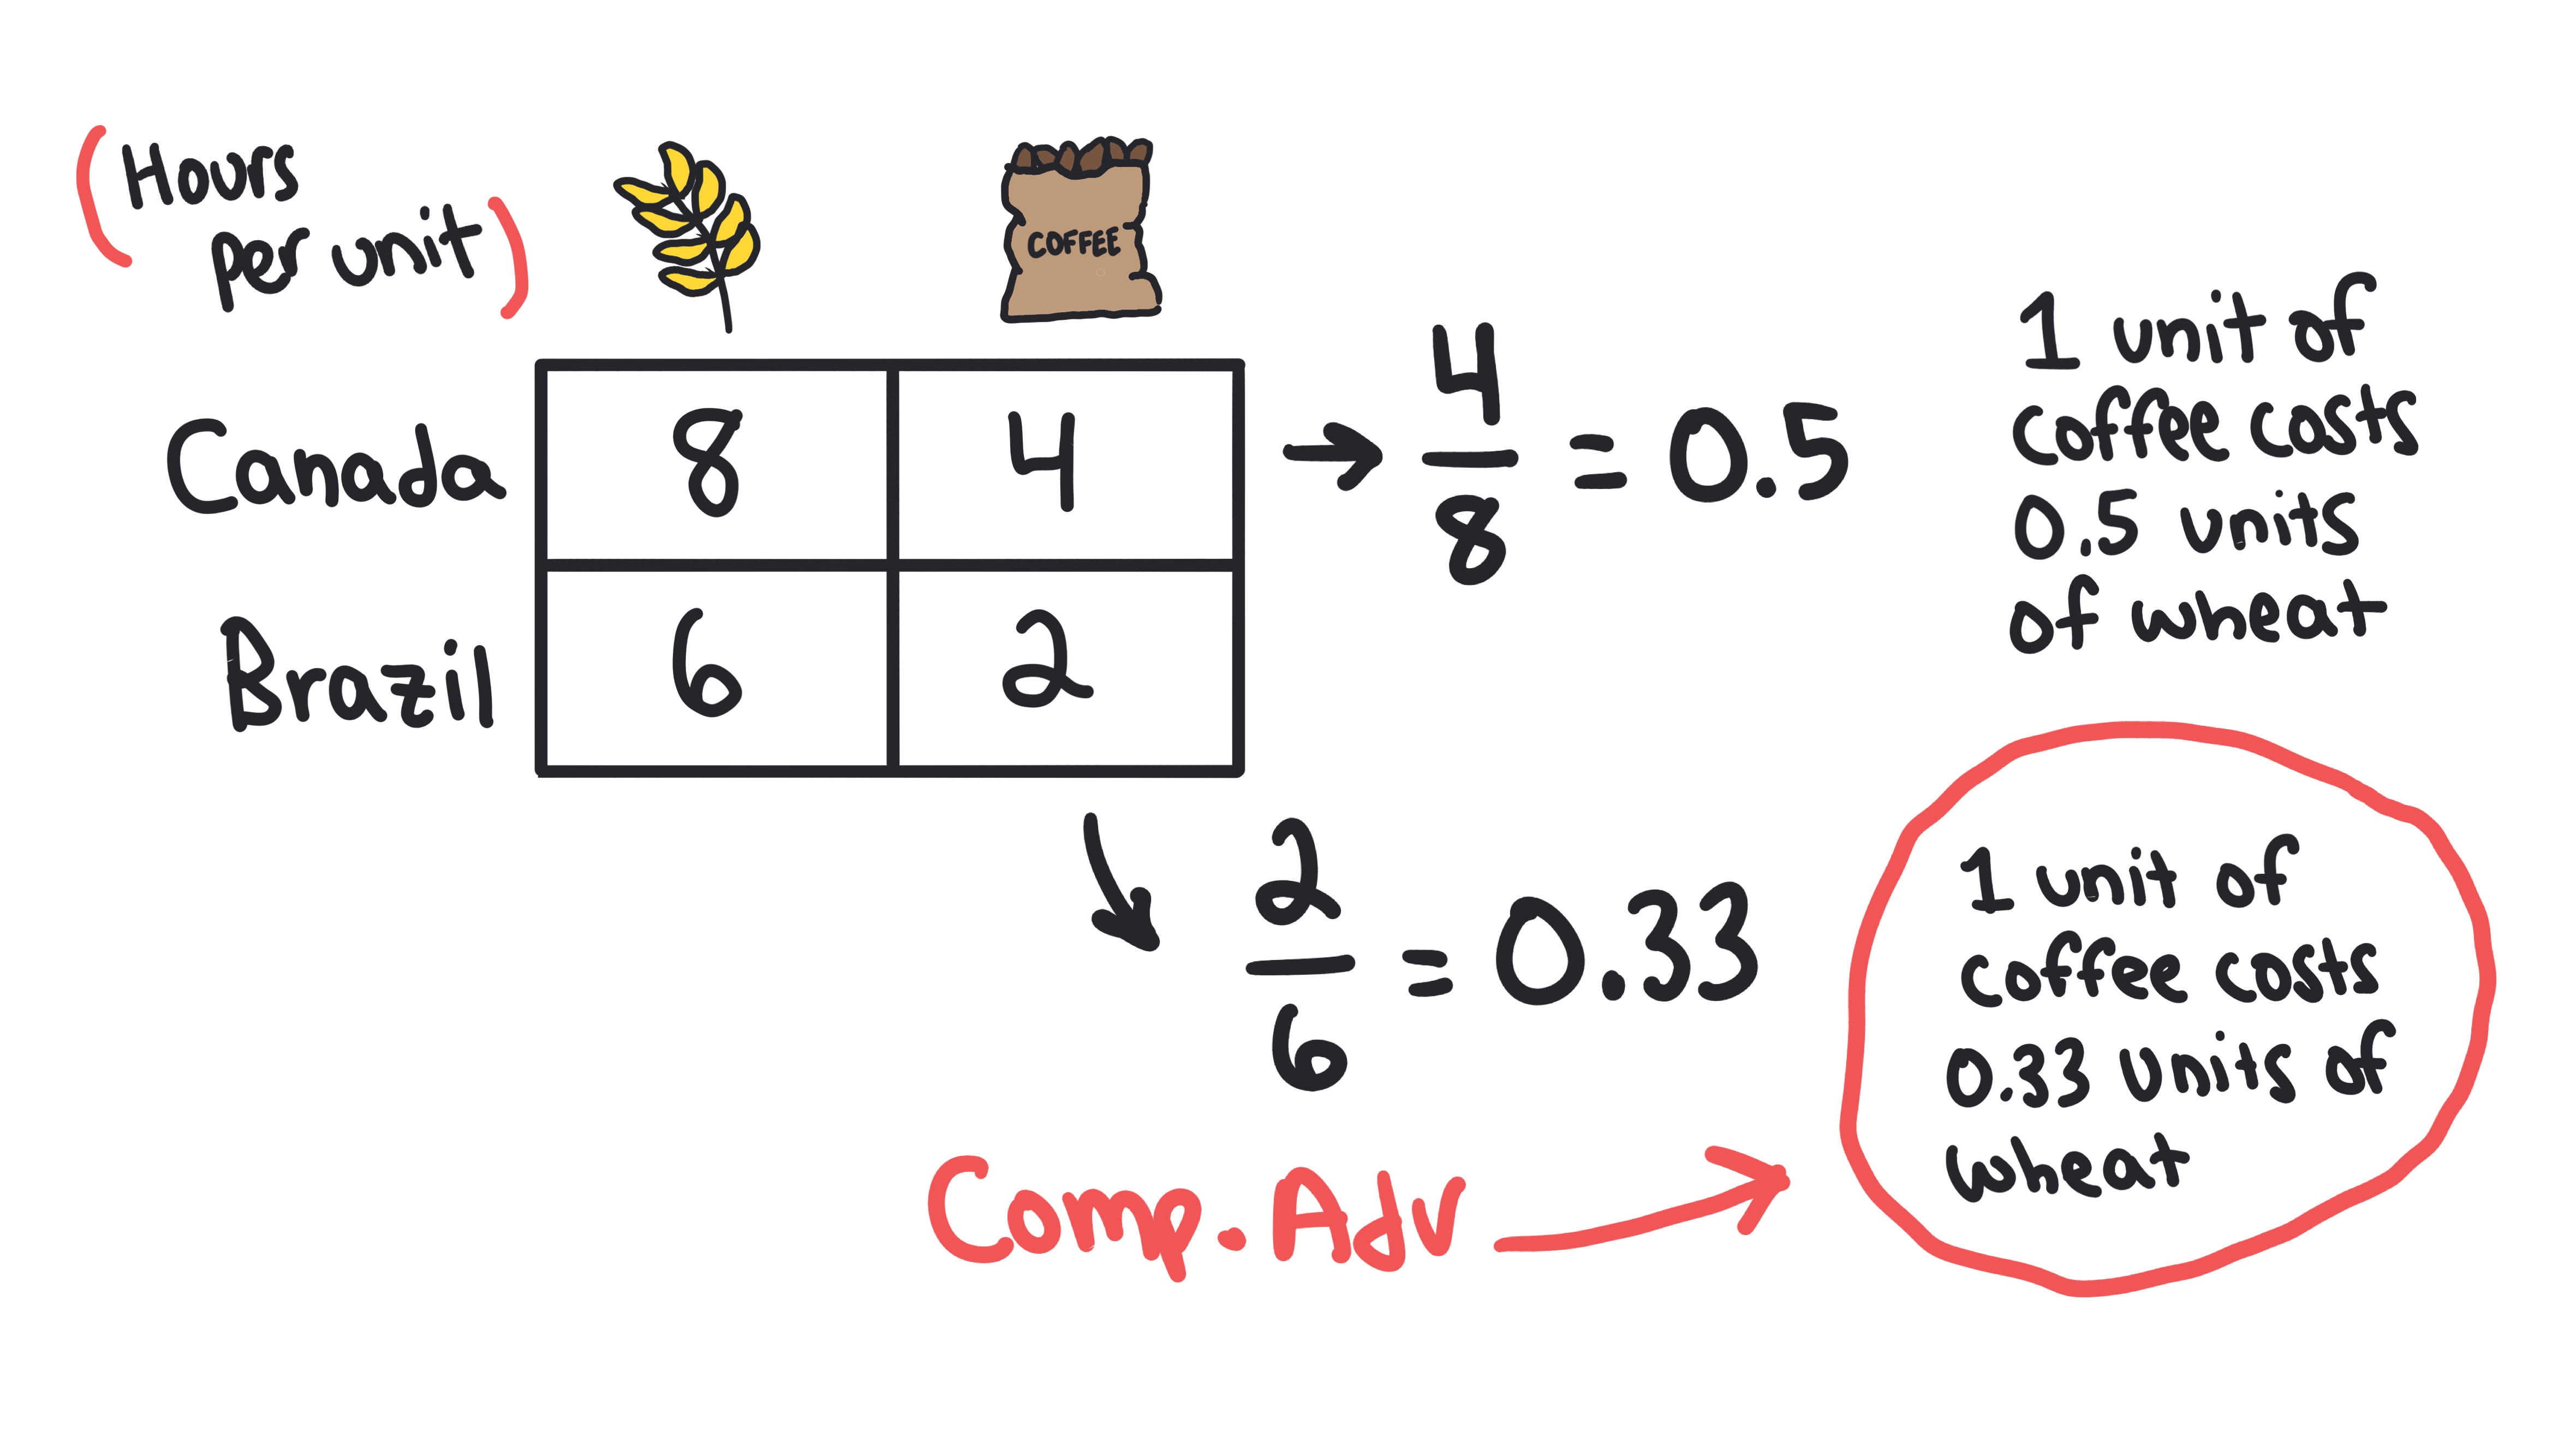
Comparative Advantage
The ability to produce a good at a lower opportunity cost than another producer.
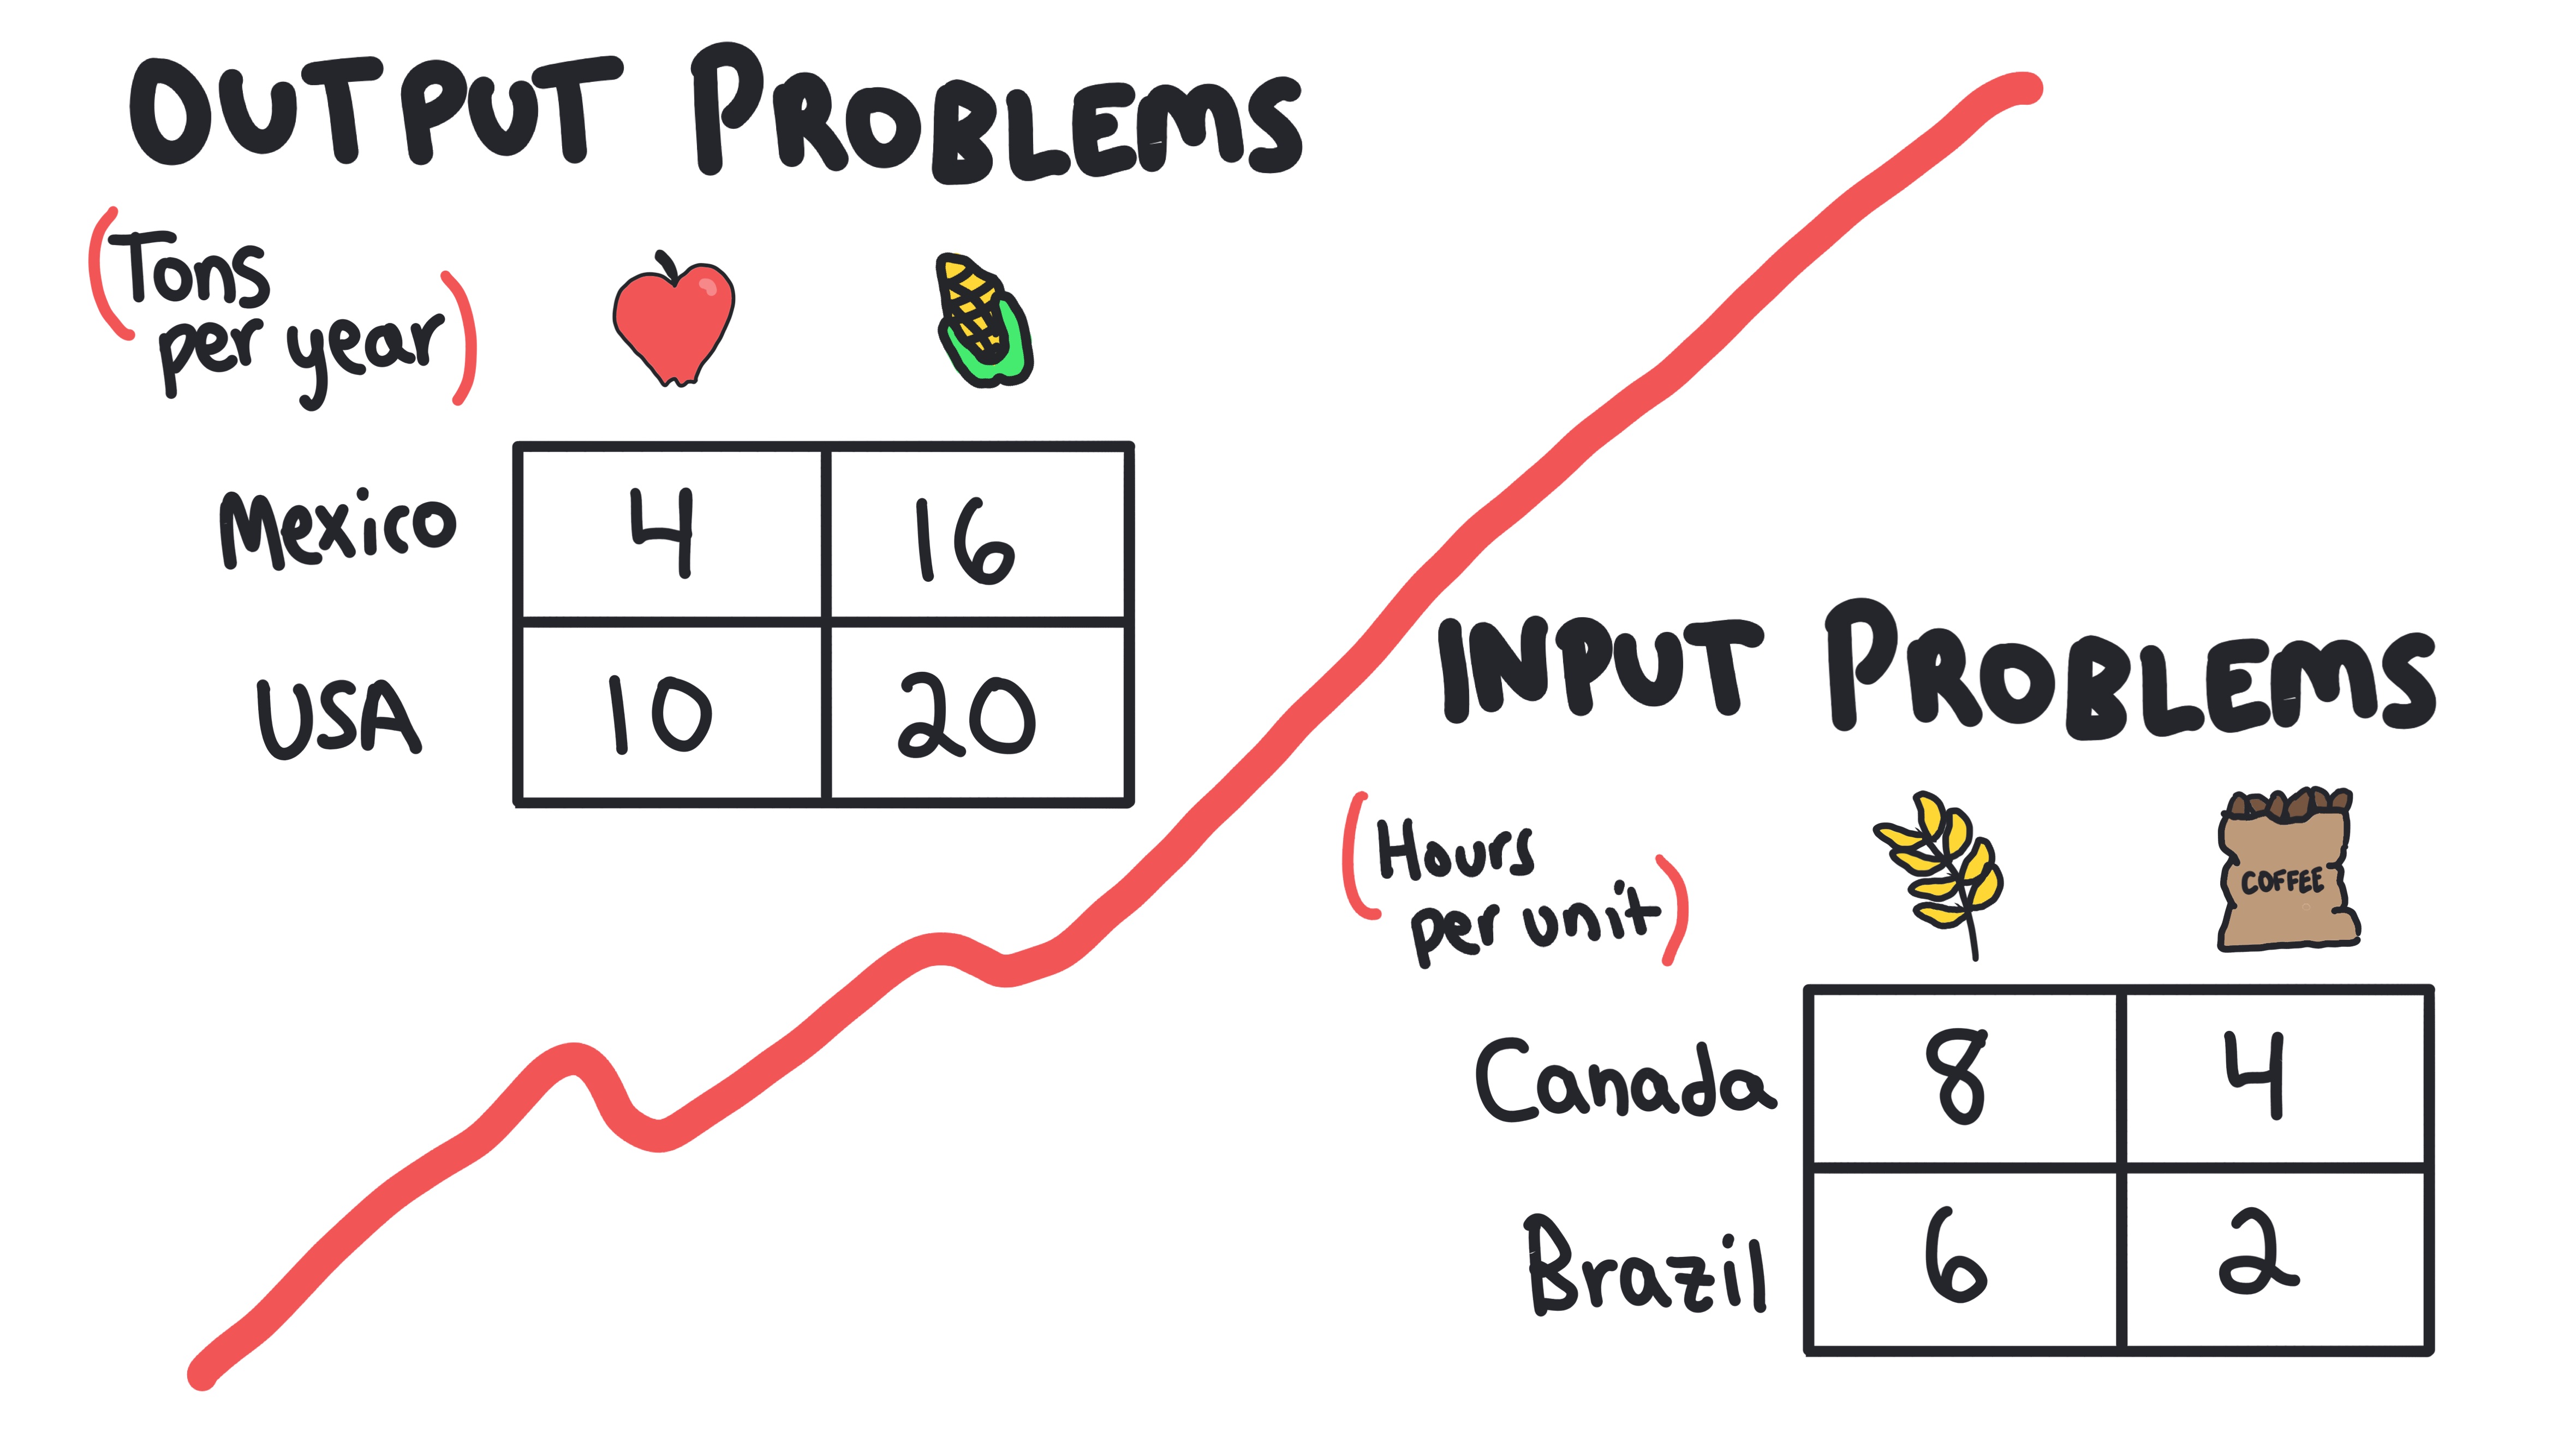
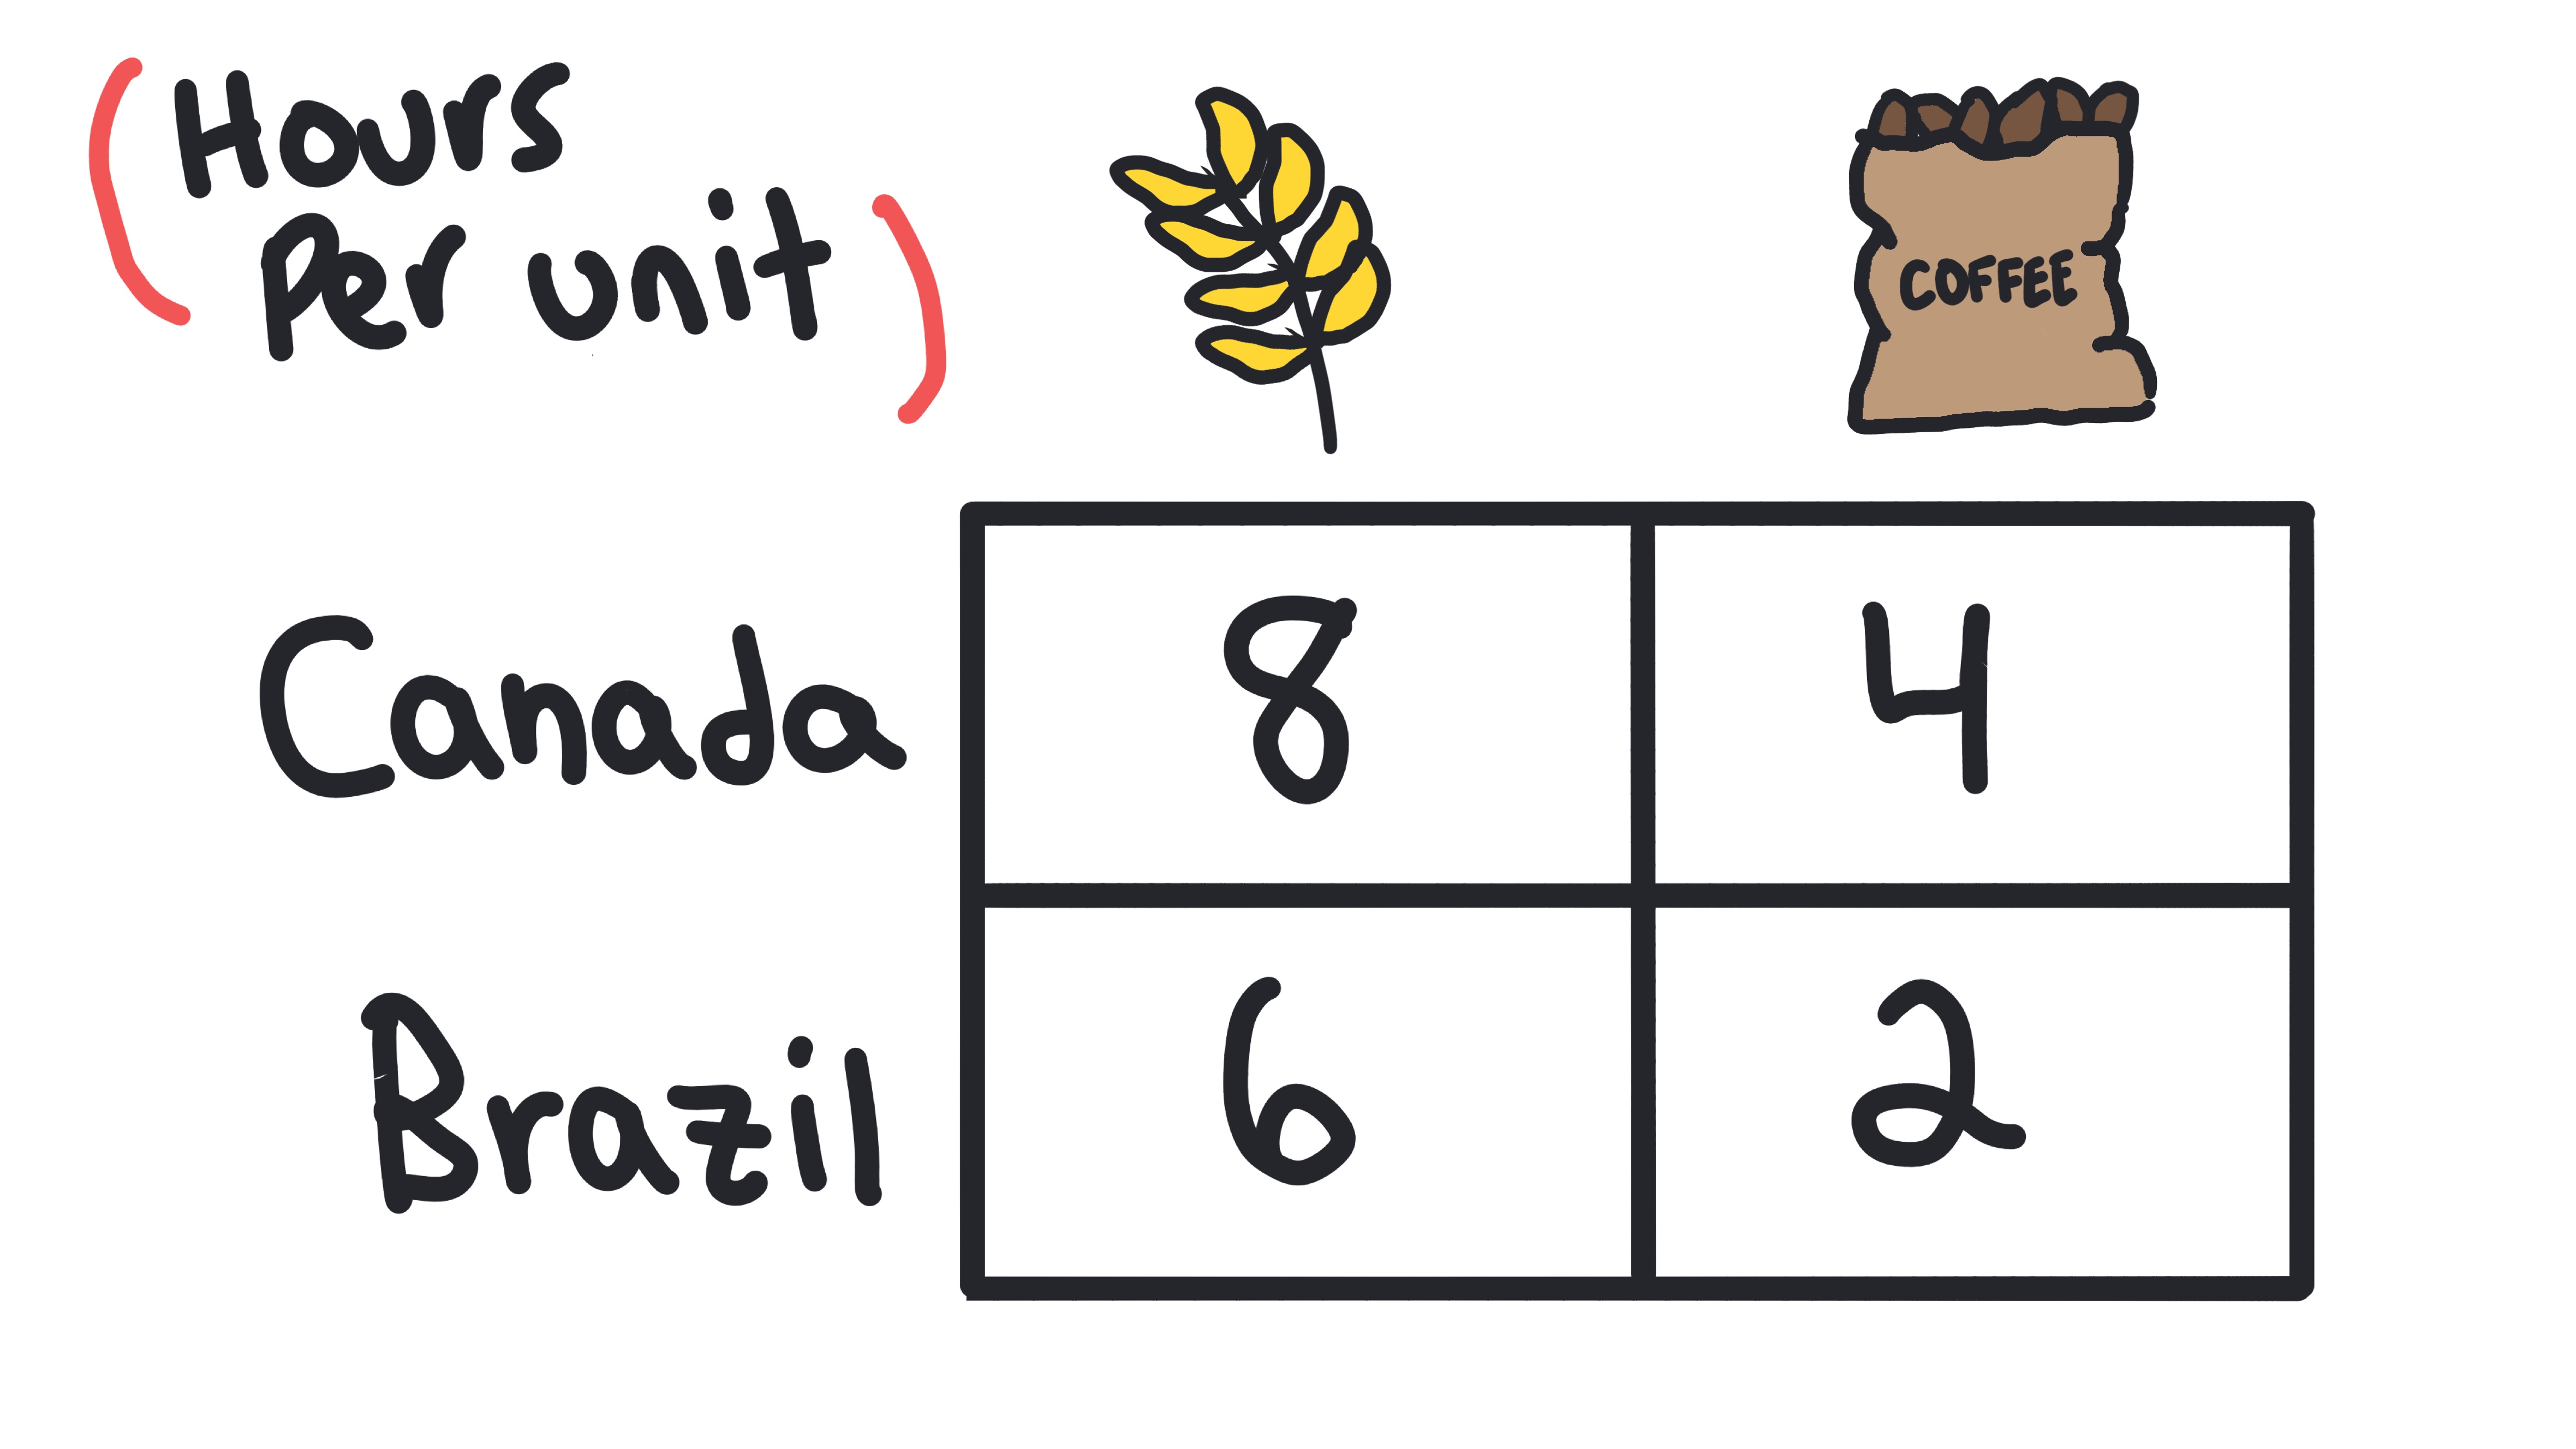
Input Problem
A type of opportunity cost problem where you are given the amount of resources (inputs) needed to produce each good.
- •How to find opportunity cost: Itself / Other
- •Example: If it takes 2 hours to produce Good A and 4 hours to produce Good B, the opportunity cost of 1 Good A is 2/4 = 0.5 Good B. The opportunity cost of 1 Good B is 4/2 = 2 Good A.
Output Problem
A type of opportunity cost problem where you are given the amount of output that can be produced with the same resources.
- •How to find opportunity cost: Other / Itself
- •Example: If a country can produce 10 units of Good A or 5 units of Good B with the same resources, the opportunity cost of 1 Good A is 5/10 = 0.5 Good B. The opportunity cost of 1 Good B is 10/5 = 2 Good A.
Terms of Trade
The rate at which one good can be exchanged for another in trade; must lie between both parties' opportunity costs to be mutually beneficial.
Whiteboards
Practice MCQs
Test your understanding of 1.3
Country A can produce 10 cars or 20 computers. Country B can produce 8 cars or 12 computers. Which country has the comparative advantage in producing cars?
1.4 - Demand
Demand
Learn about the law of demand, demand curves, and demand schedules.
Key Terms & Definitions
Demand
The relationship between the price of a good or service and the quantity consumers are willing and able to purchase at various prices during a specific time period.
- •Demand represents willingness AND ability to pay
- •Demand is always downward sloping (Law of Demand)
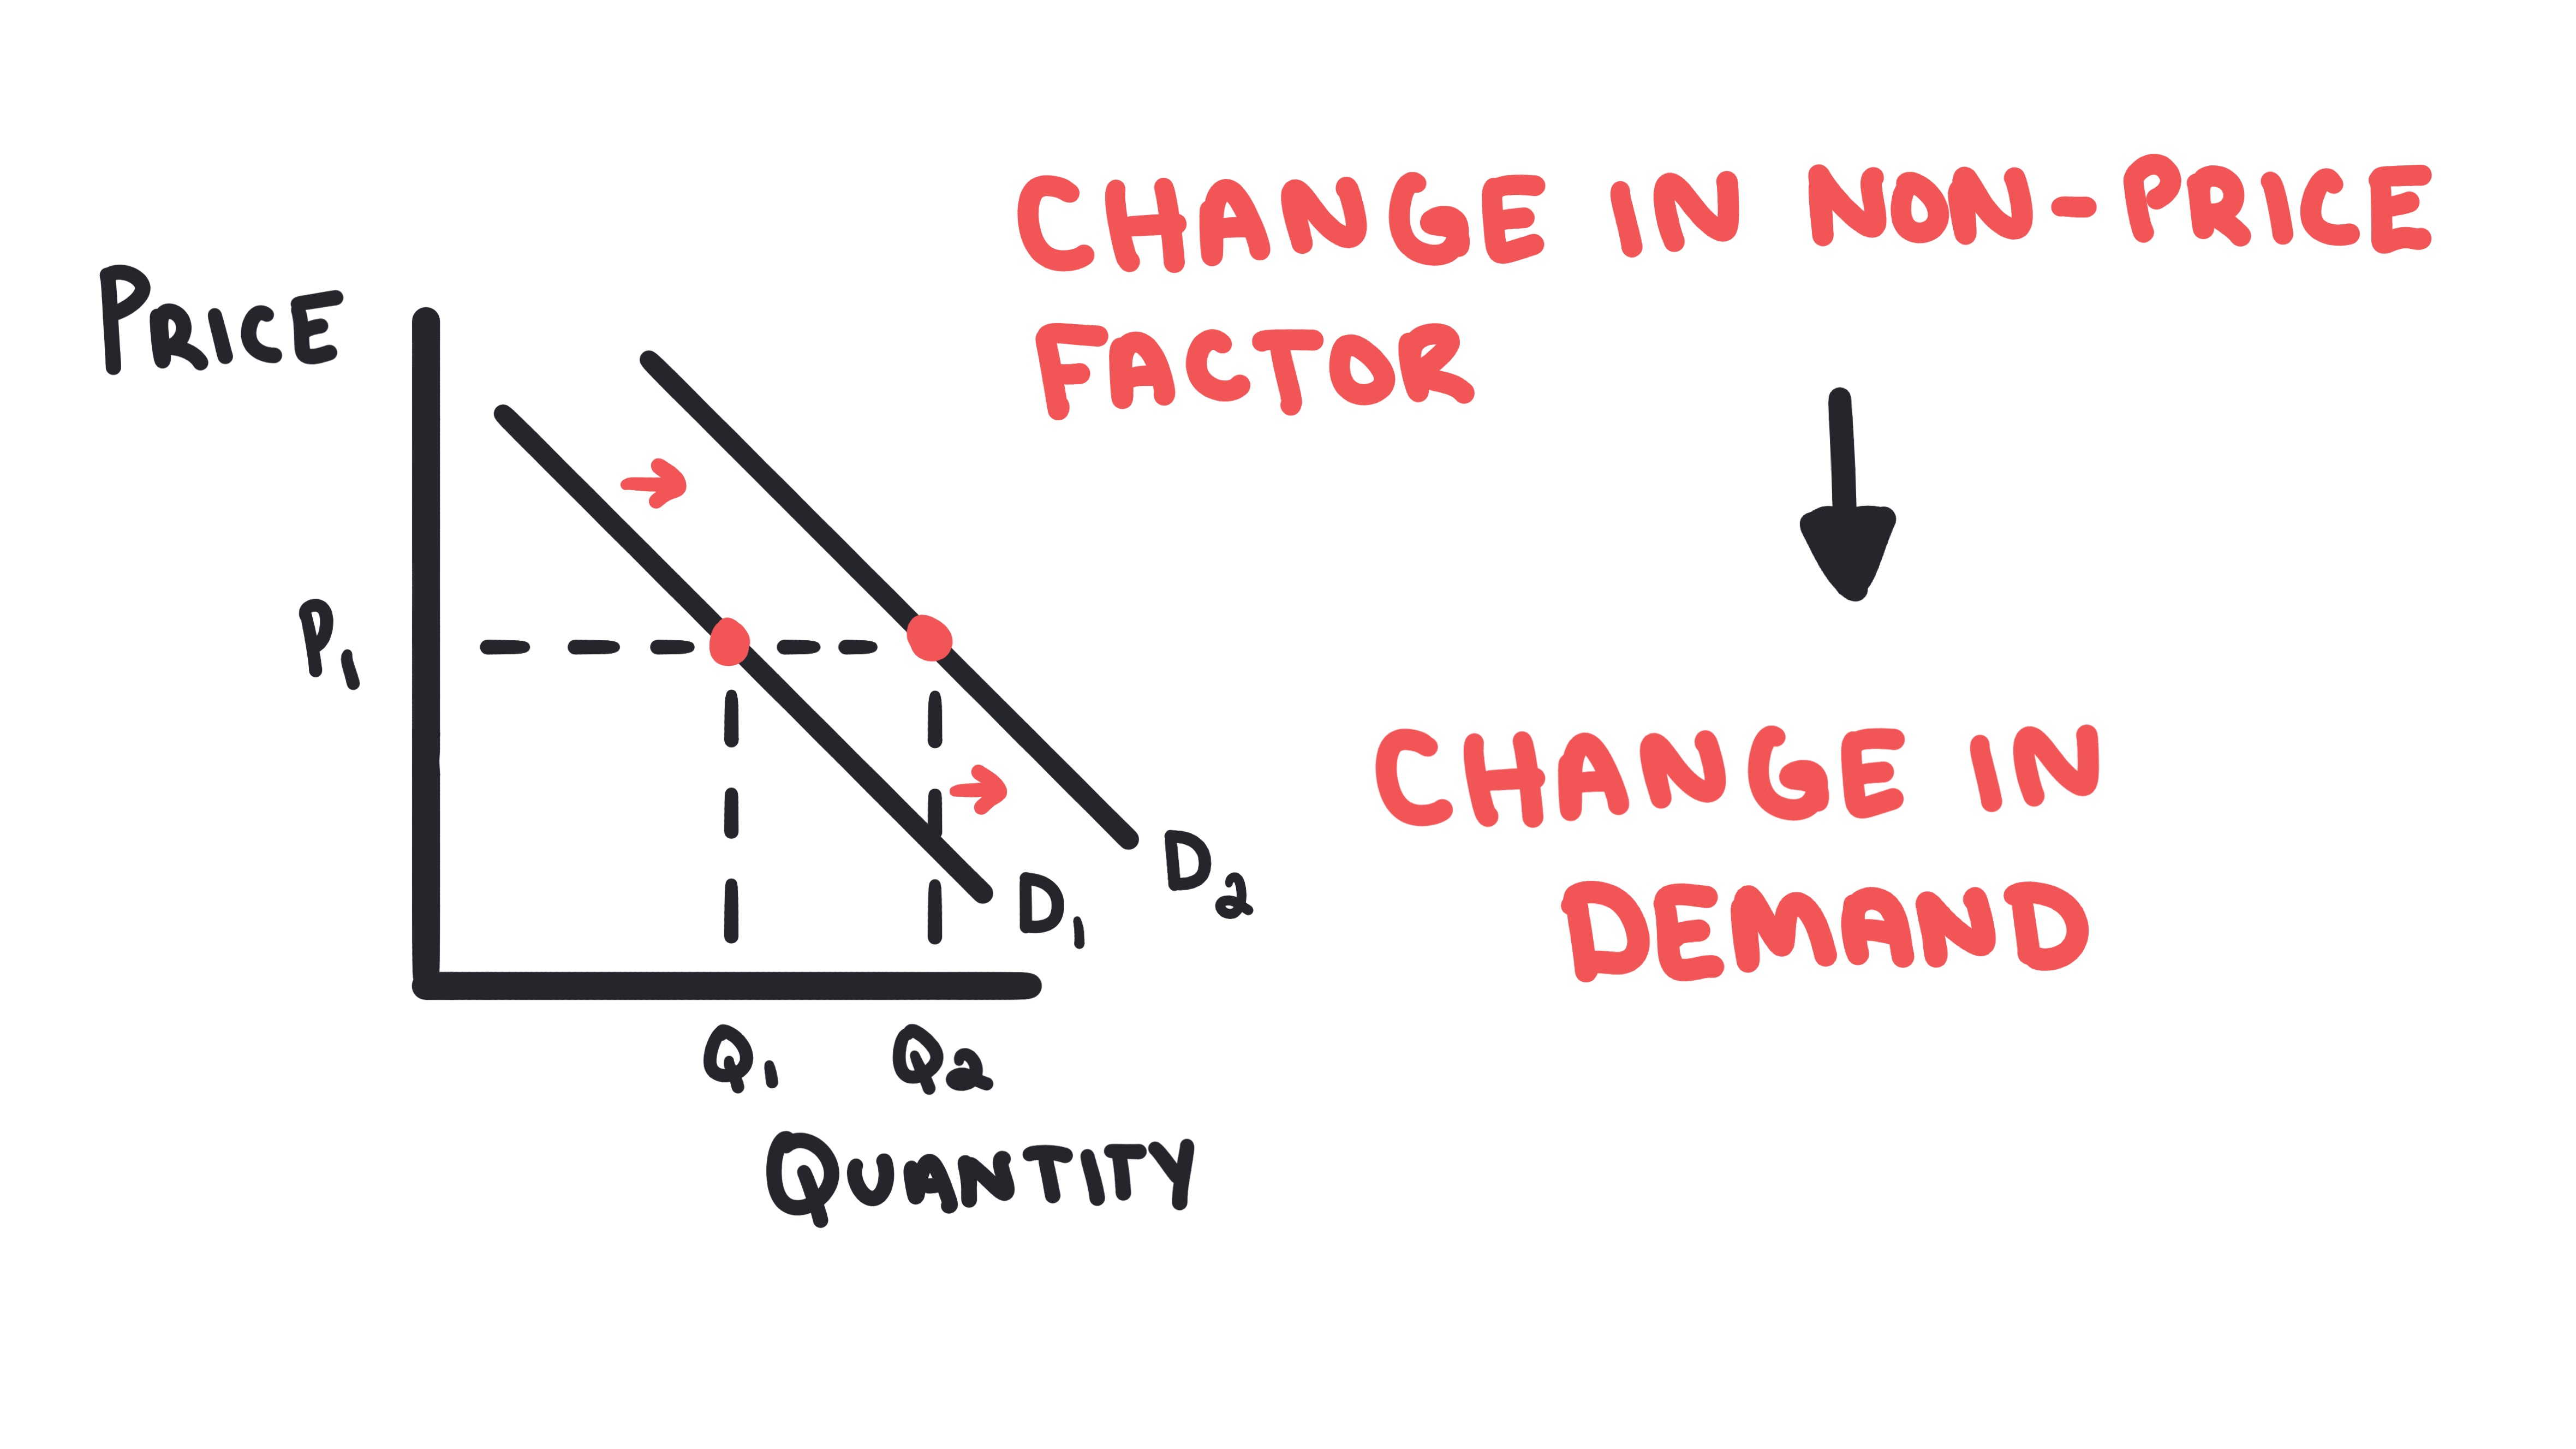
- •Demand can shift due to non-price factors
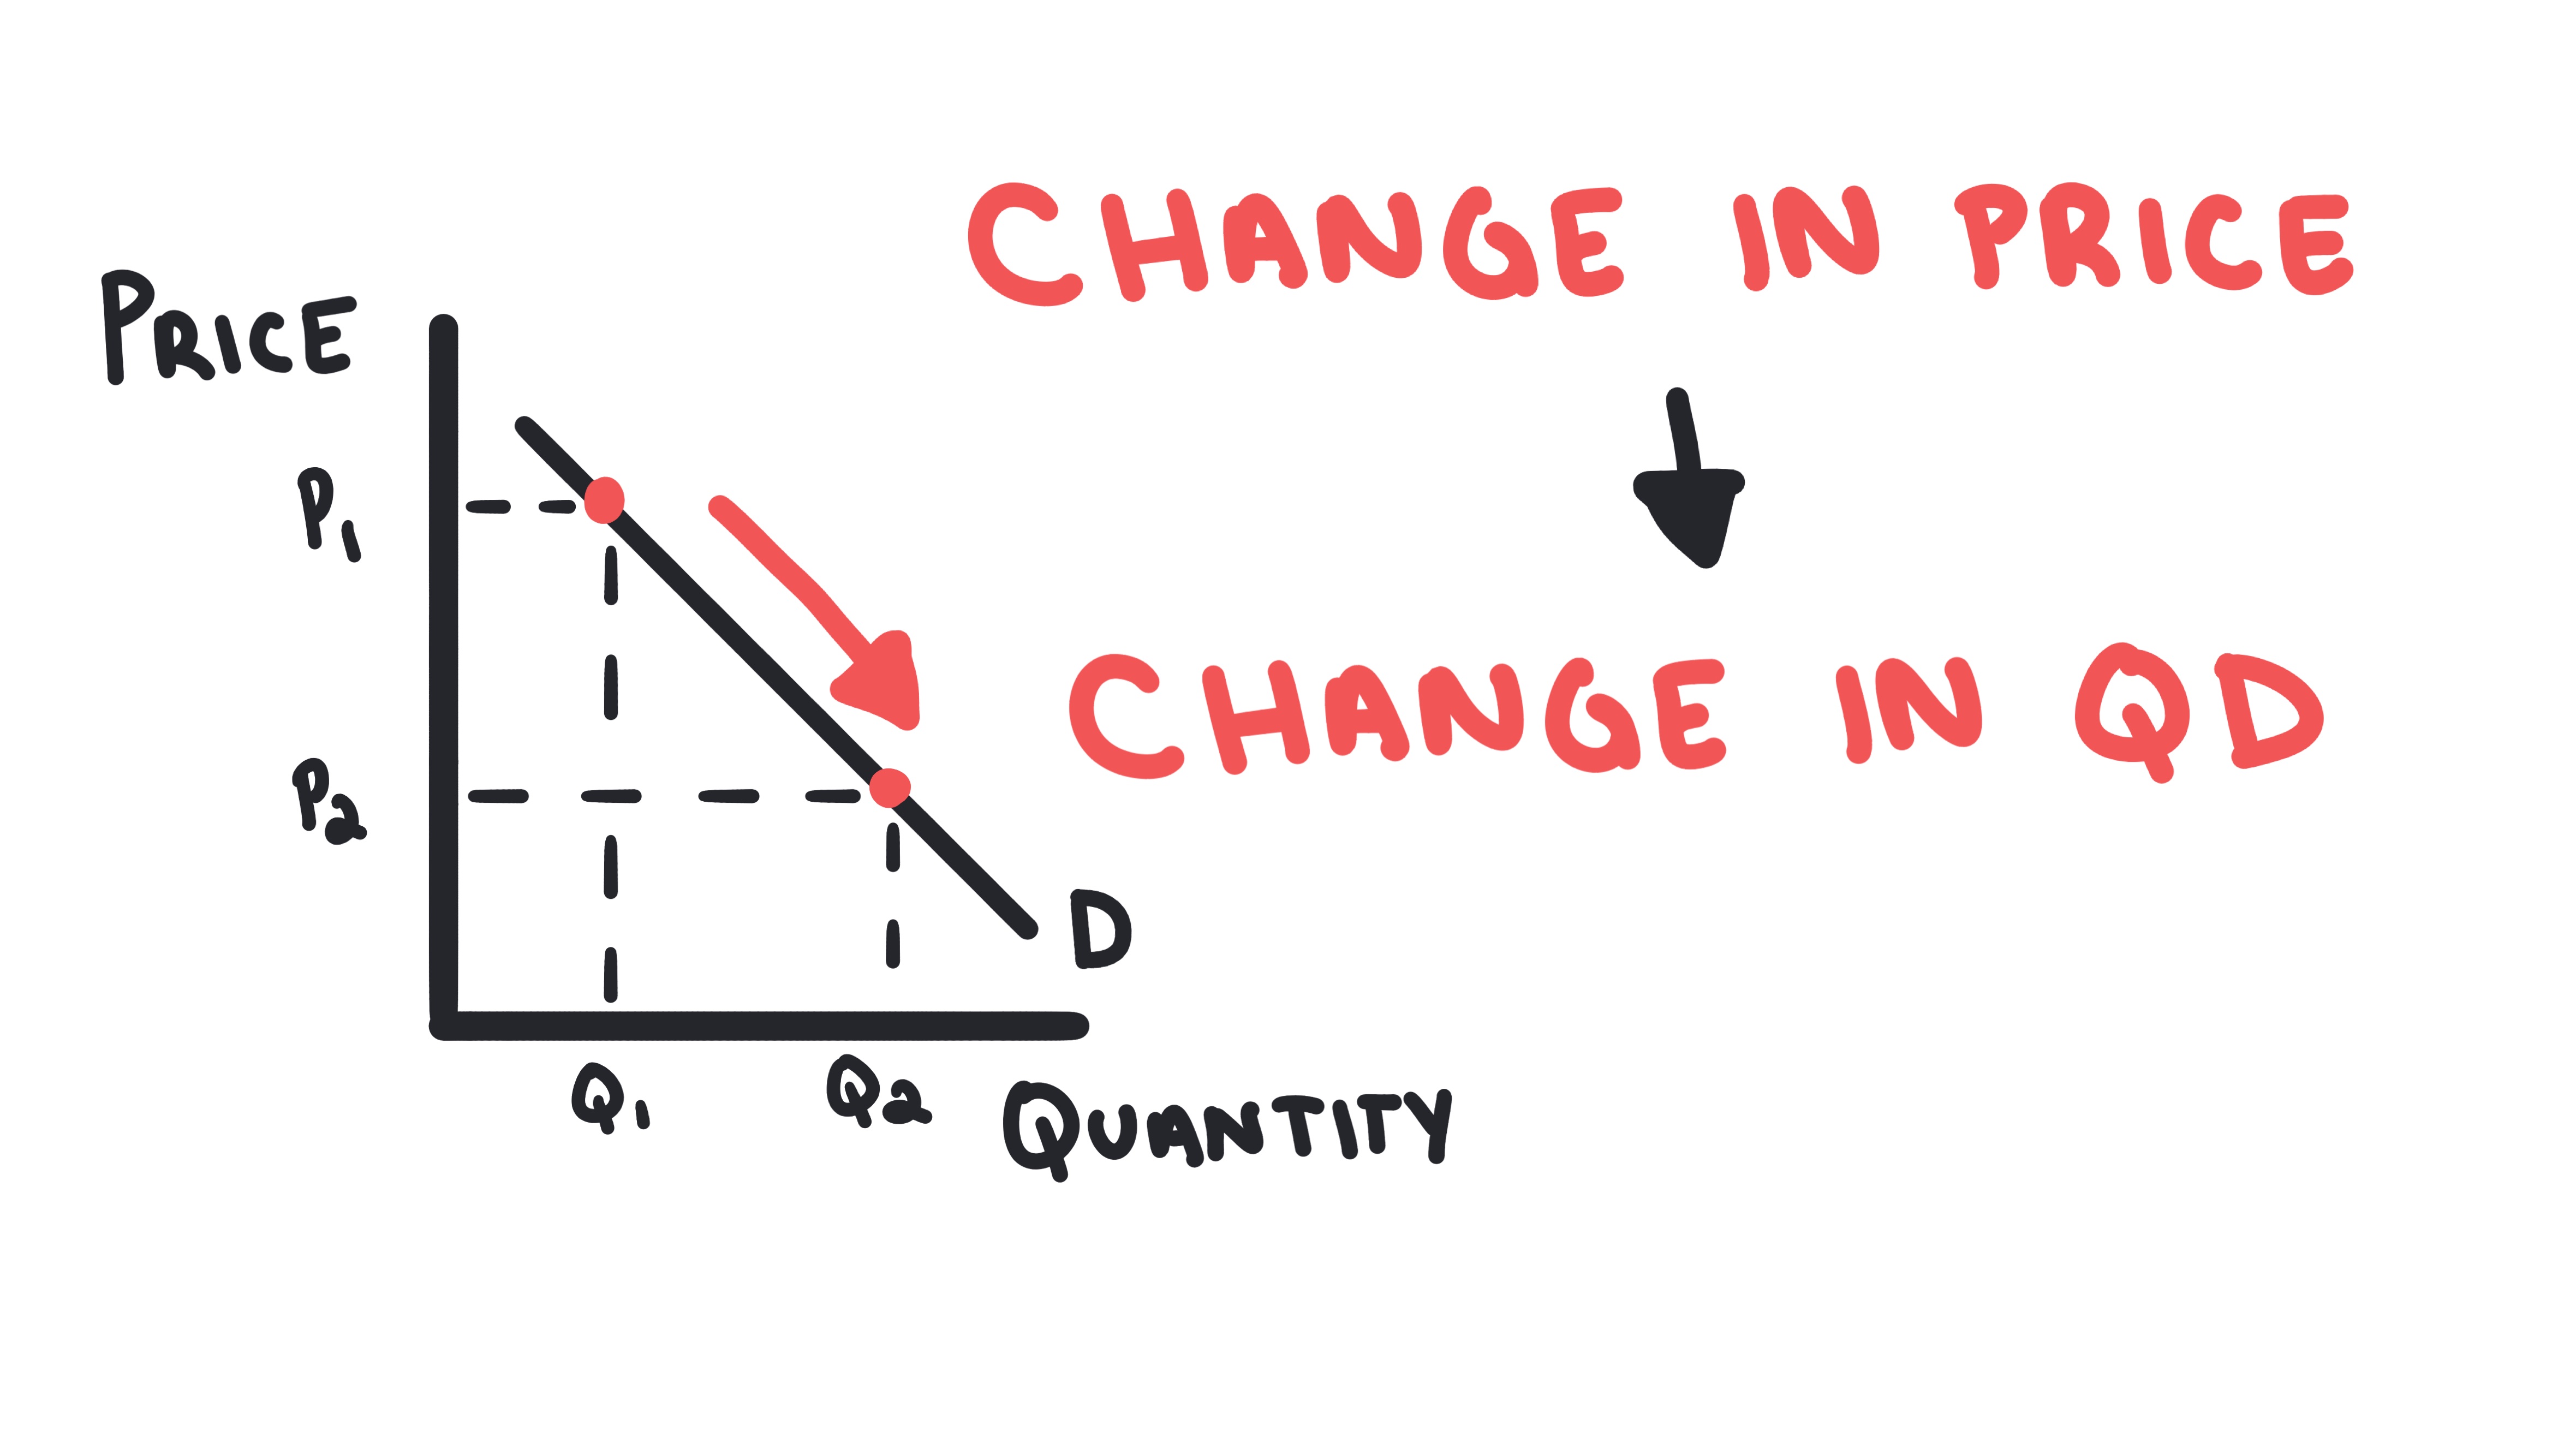
Law of Demand
The principle that, as the price of a good or service increases, the quantity demanded will decrease, and vice versa.
- •Price and quantity demanded have an inverse relationship
- •The demand curve always slopes downward from left to right
- •Two main reasons for the law of demand: substitution effect and income effect
Determinants of Demand
Factors other than price that shift the demand curve.
- •Tastes and Preferences: Fidget spinners are no longer cool, so demand for them decreases.
- •Income: As a country becomes more wealthy, demand for luxury goods increases.
- •Prices of Related Goods: If Apple Music increases their price, demand for Spotify increases.
- •Number of Buyers: If more people move to Miami, demand for apartments in Miami increases.
- •Expectations: If people expect the price of gasoline to increase next week, they will buy more gasoline this week.
Normal Good
A good for which demand increases as consumer income rises, and demand decreases as consumer income falls (positive income elasticity).
- •Examples include most goods: cars, electronics, clothing
- •Has positive income elasticity of demand
- •Demand curve shifts right when income increases
- •Demand curve shifts left when income decreases
Inferior Good
A good for which demand decreases as consumer income rises, and demand increases as consumer income falls (negative income elasticity).
- •Examples include ramen noodles, used cars, public transportation
- •Has negative income elasticity of demand
- •Demand curve shifts left when income increases
- •Demand curve shifts right when income decreases
Substitutes
Two goods for which an increase in the price of one leads to an increase in the demand for the other (positive cross-price elasticity).
- •Examples: Coke and Pepsi, butter and margarine
- •Have positive cross-price elasticity of demand
- •Price increase of one shifts demand for the other right
- •Consumers can easily switch between them
Complements
Two goods for which an increase in the price of one leads to a decrease in the demand for the other (negative cross-price elasticity). Goods often consumed together.
- •Examples: peanut butter and jelly, cars and gasoline
- •Have negative cross-price elasticity of demand
- •Price increase of one shifts demand for the other left
- •Goods are consumed together as a bundle
Demand Curve
A downward-sloping graph showing the relationship between price and quantity demanded.
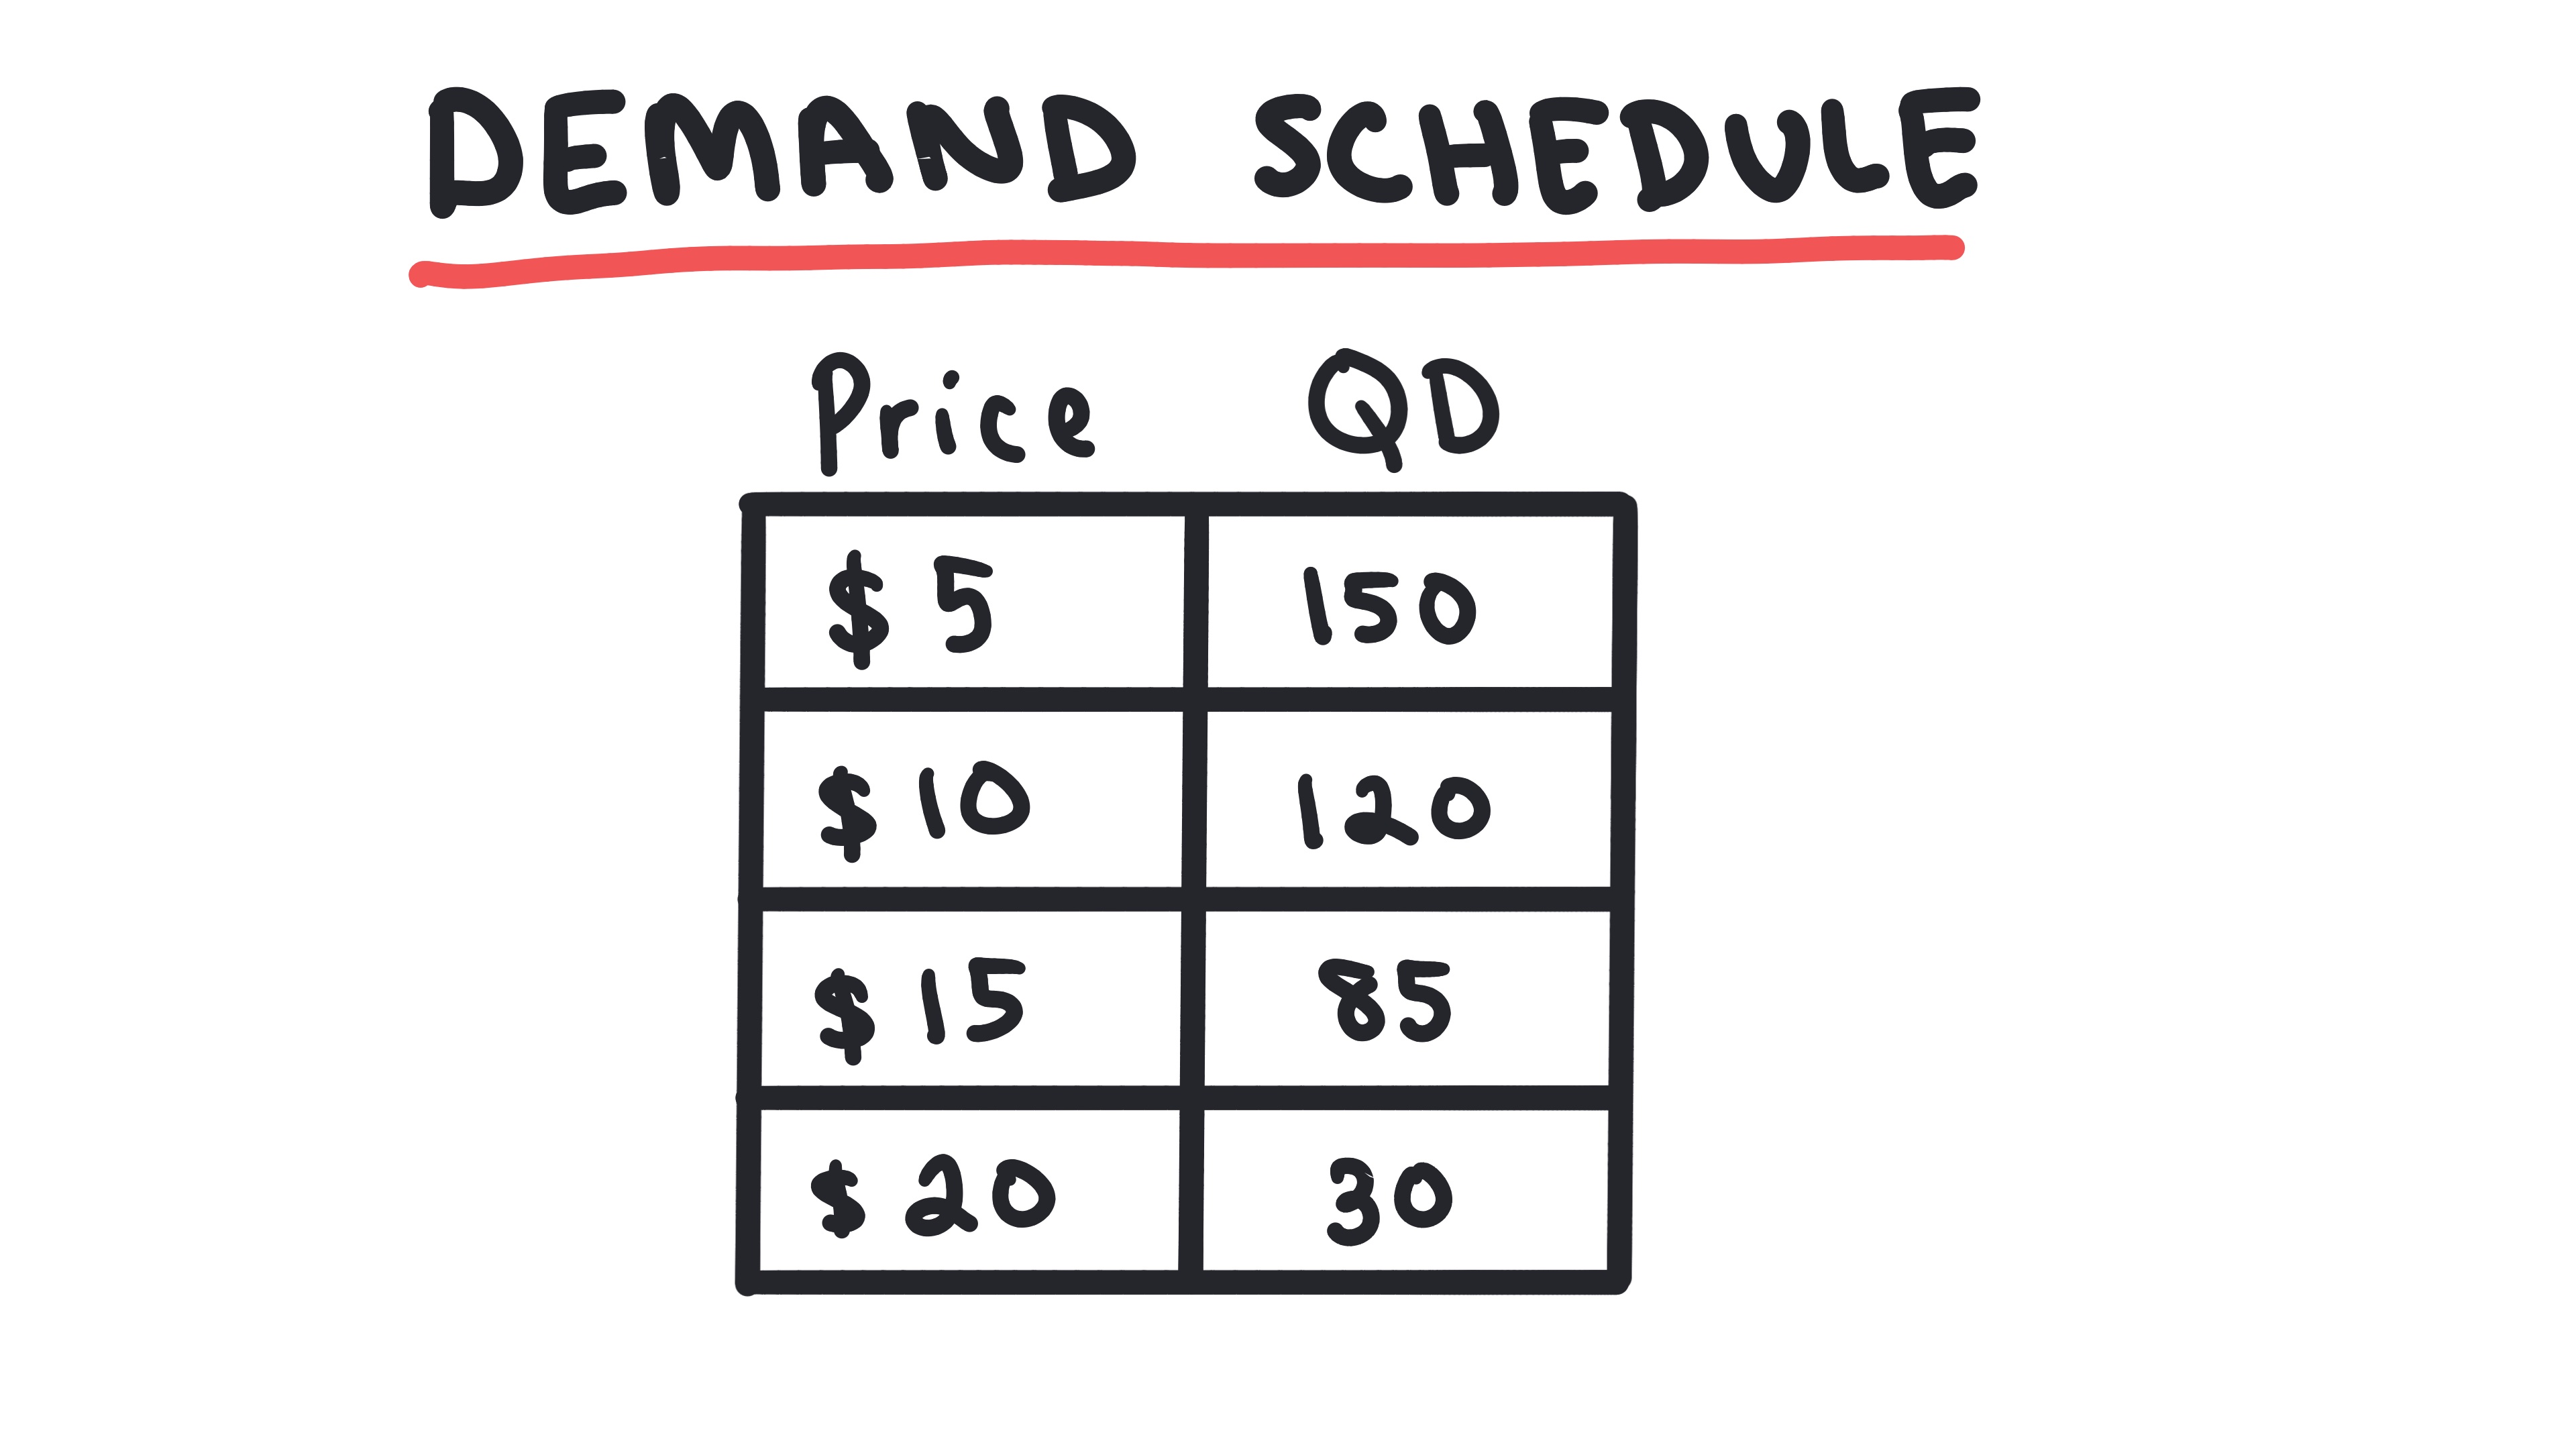
Demand Schedule
A table showing the inverse relationship between the price of a good and quantity demanded.
Whiteboards
Practice MCQs
Test your understanding of 1.4
According to the law of demand, an increase in the price of a good, ceteris paribus, leads to:
1.5 - Supply
Supply
Learn about the law of supply, supply curves, and supply schedules.
Key Terms & Definitions
Supply
The relationship between the price of a good or service and the quantity producers are willing and able to sell at various prices during a specific time period, ceteris paribus.
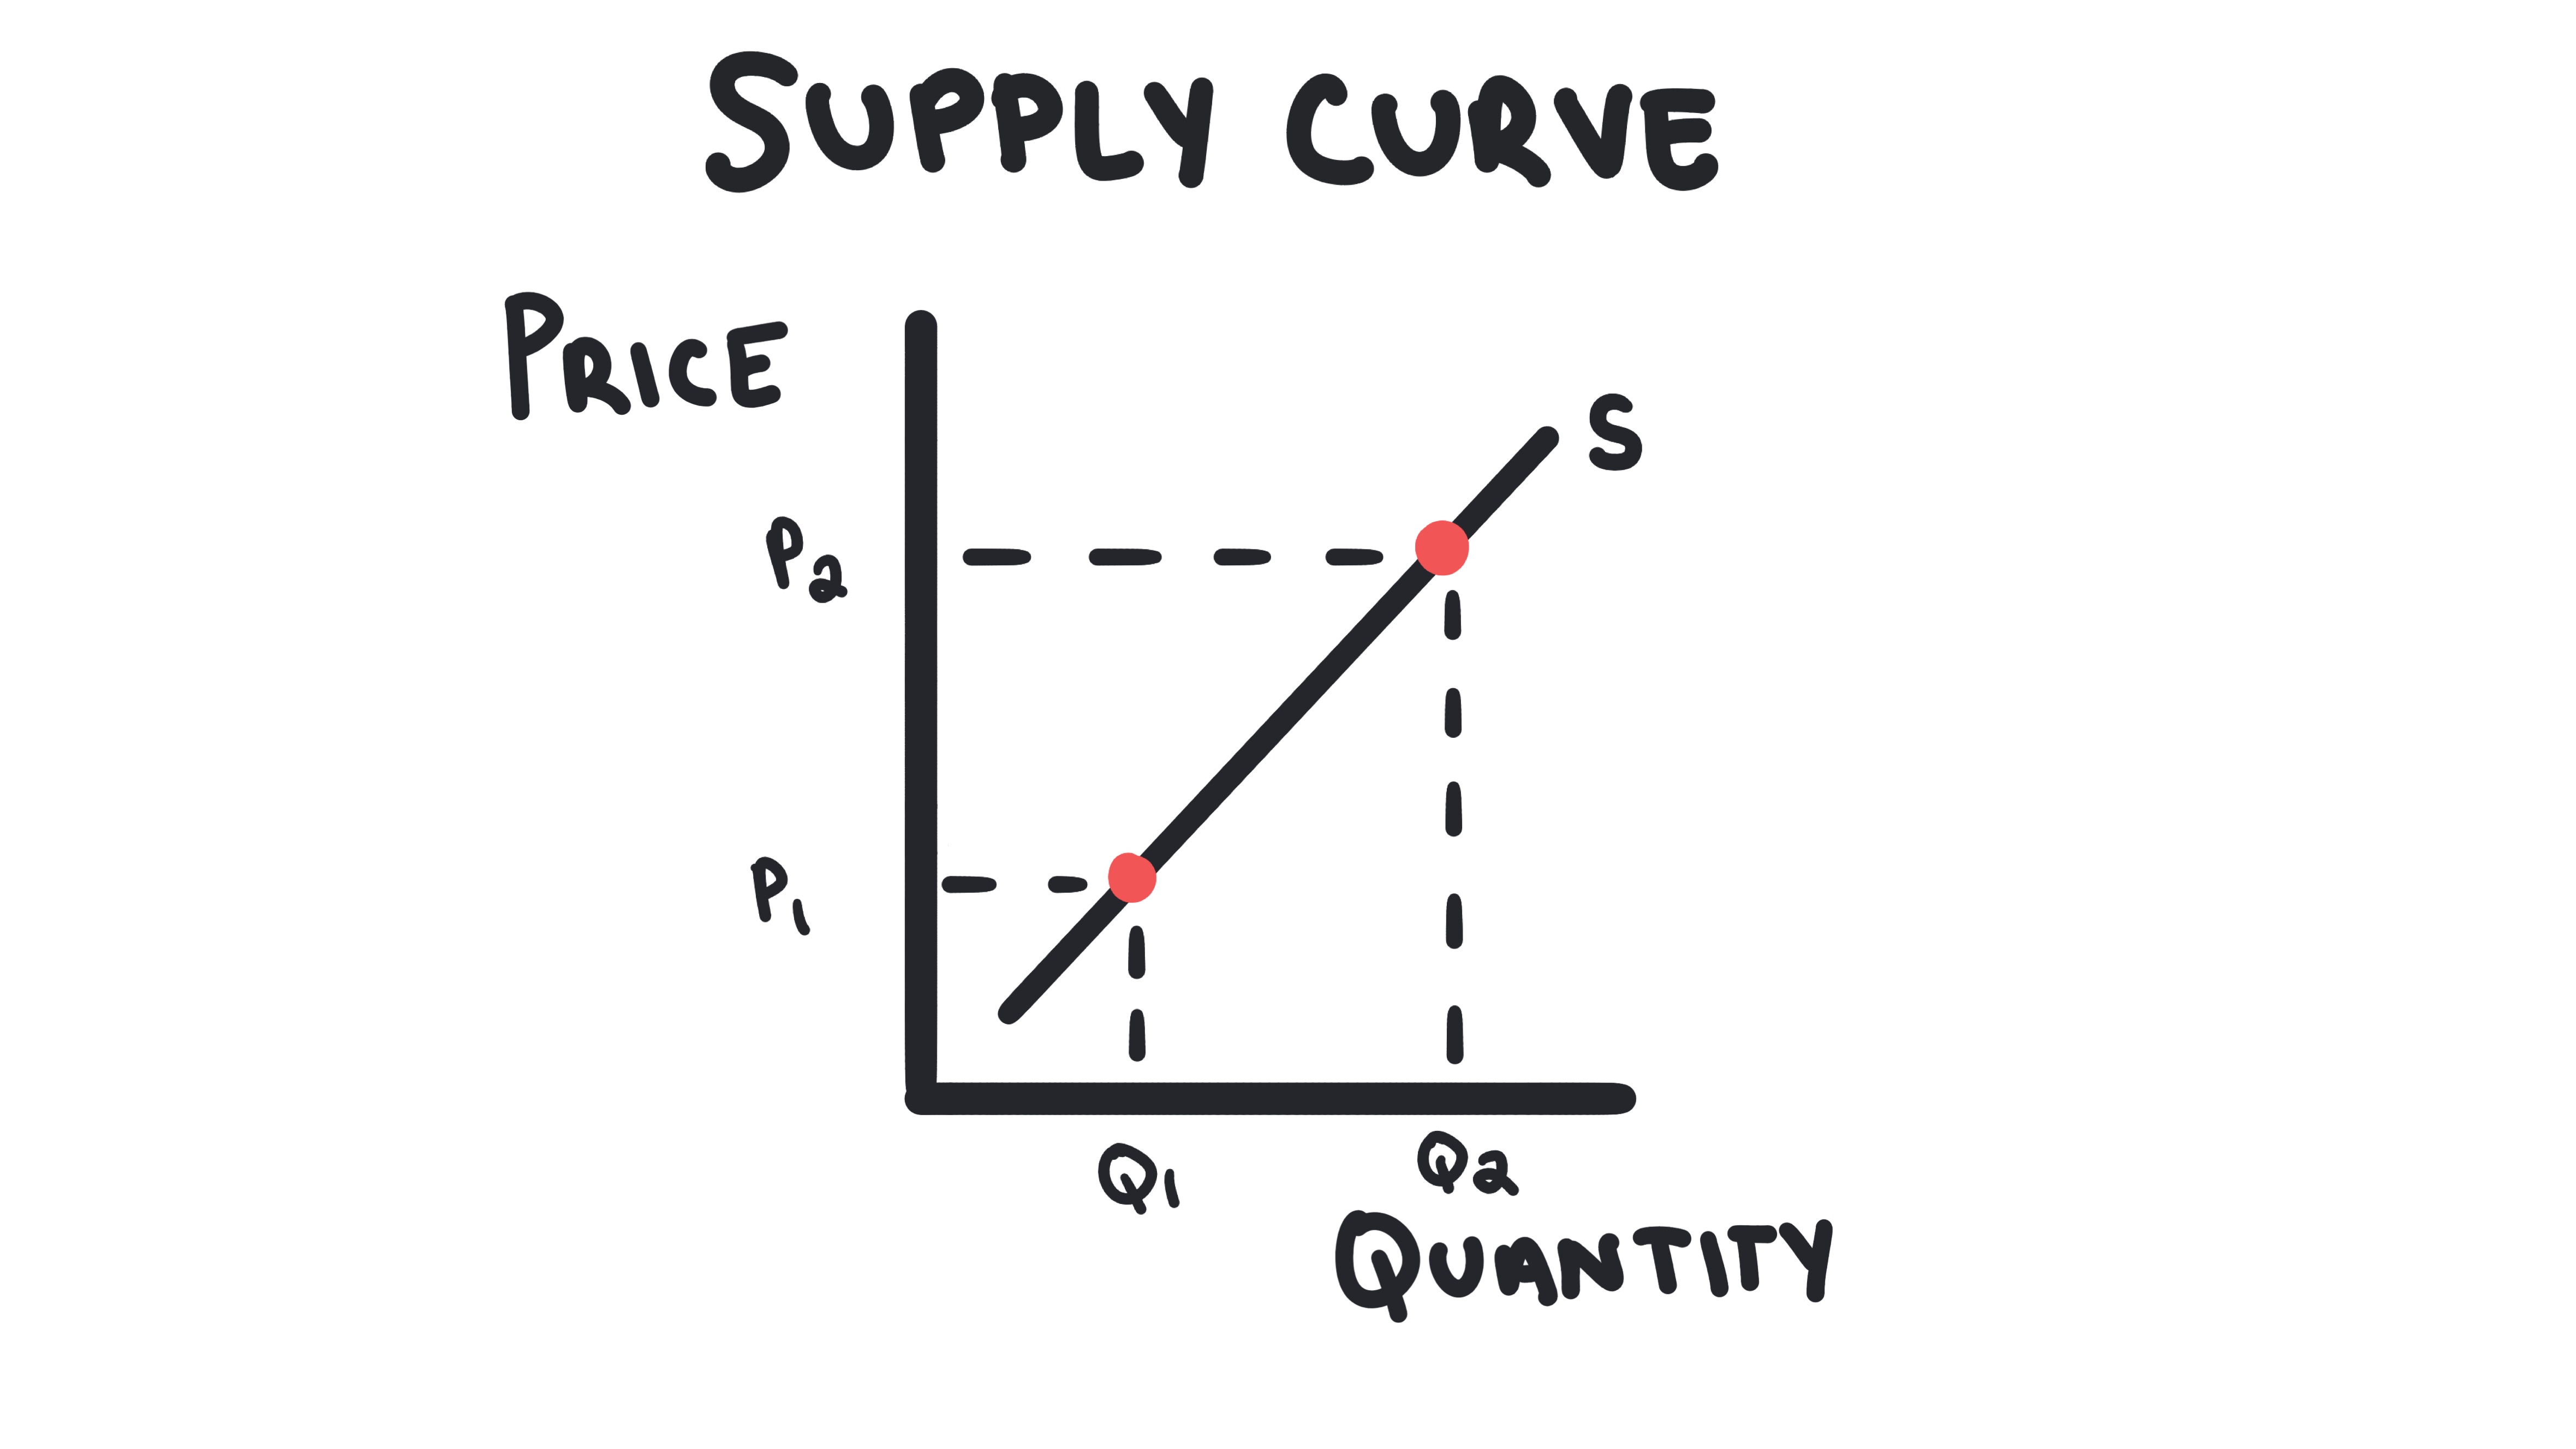
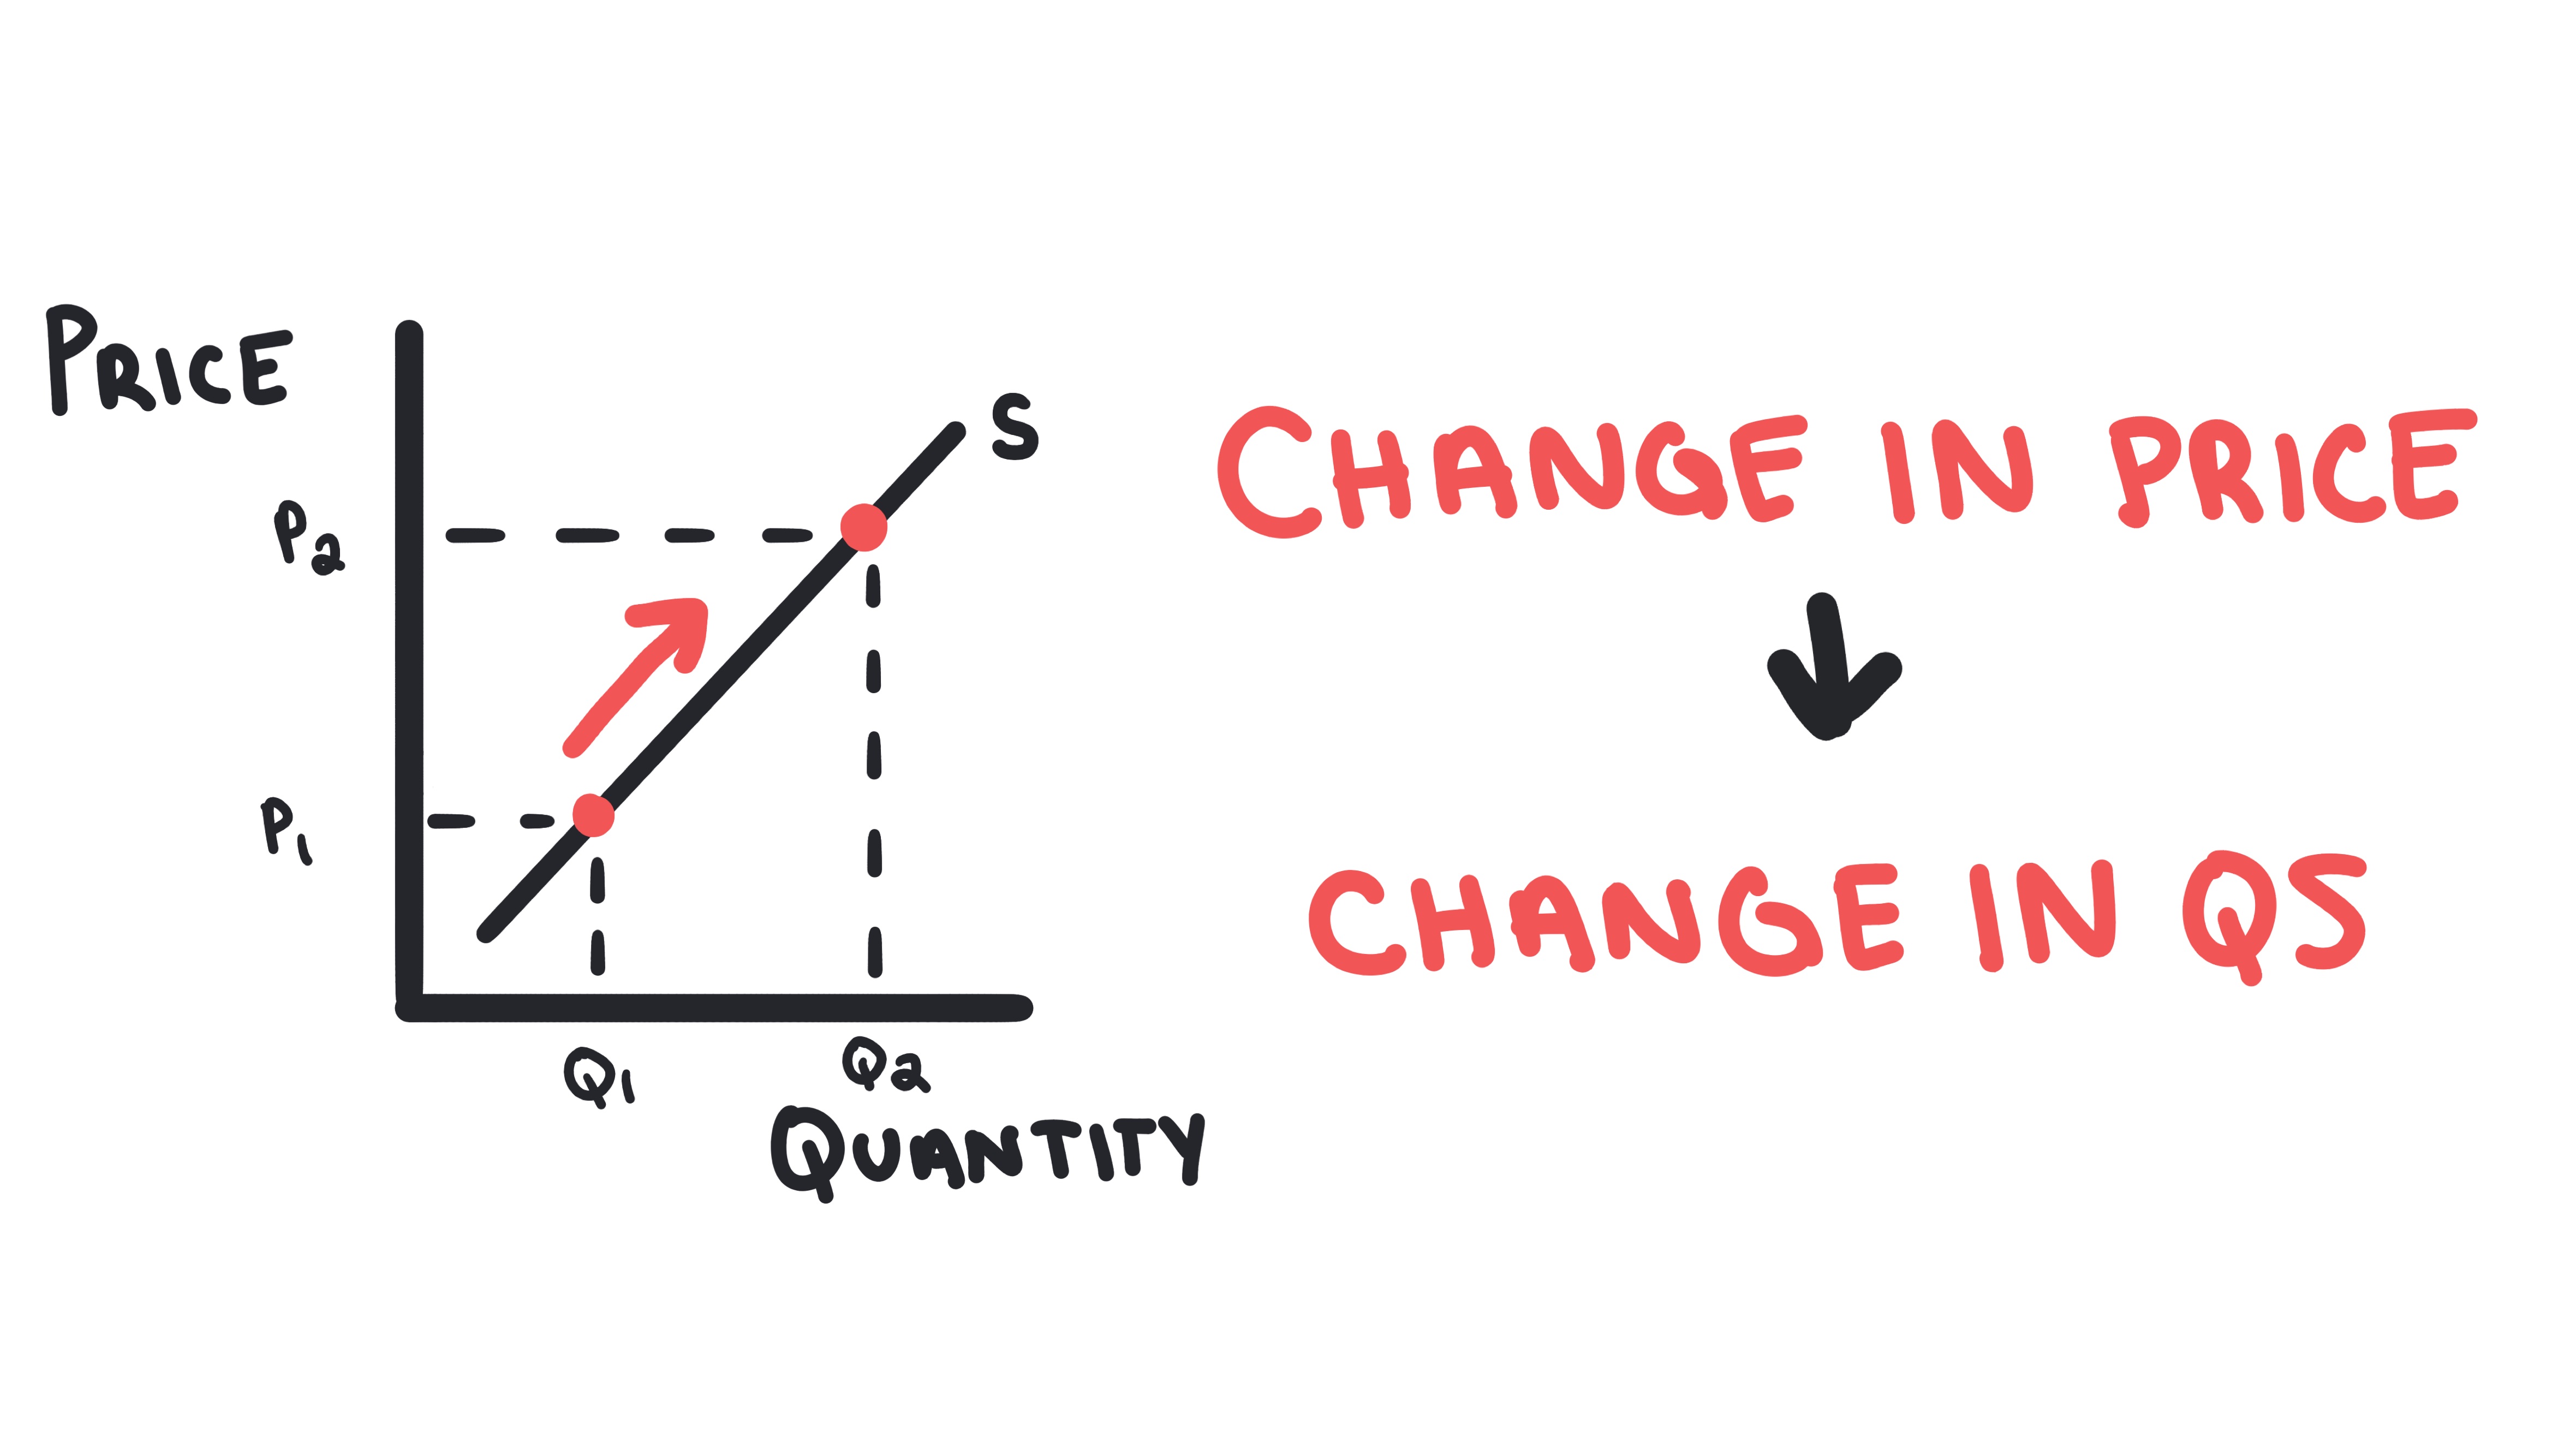
Law of Supply
The principle that, as the price of a good or service increases, the quantity supplied will increase, and vice versa.
- •Price and quantity supplied have a direct relationship
- •The supply curve always slopes upward
- •Two main reasons for the law of supply: profit motive and opportunity cost
Determinants of Supply
Factors other than price that shift the supply curve.
- •Resource Prices: Higher input costs shift supply left
- •Technology: Better technology shifts supply right
- •Number of Sellers: More sellers shifts supply right
- •Government Actions: Taxes shift supply left, subsidies shift right
Resource/Input Prices
The cost of factors of production (land, labor, capital, entrepreneurship) used to produce goods and services. Changes in these costs shift the supply curve.
- •Higher input costs shift supply curve left (decrease supply)
- •Lower input costs shift supply curve right (increase supply)
- •Examples: If I produce wooden tables, and the price of wood increases, I can produce fewer tables with the same amount of money.
Technology
The methods, processes, and techniques used to produce goods and services. Improvements in technology can increase productivity and shift the supply curve.
- •Better technology shifts supply curve right (increase supply)
- •Increases productivity and reduces production costs
- •Examples: New improved fertilizer allows farmers to produce more crops with the same amount of land and labor.
Prices of Other Goods
The prices of alternative goods that producers could produce instead. Changes in these prices can affect the supply of the current good.
- •Higher prices of alternatives shift supply left (decrease supply)
- •Lower prices of alternatives shift supply right (increase supply)
- •Producers switch to more profitable alternatives
- •Examples: If the price of durian increase, farmers will produce more durian and less other fruits.
Number of Sellers
The quantity of firms or producers in a market. Changes in the number of sellers directly affect the total supply in the market.
- •More sellers shift supply curve right (increase supply)
- •Fewer sellers shift supply curve left (decrease supply)
- •Each seller contributes to total market supply
- •Examples: new firms entering, existing firms exiting
Expectations
Producers' beliefs about future market conditions, including prices, costs, and demand. These expectations can influence current supply decisions.
- •Expected higher future prices shift supply left (decrease current supply)
- •Expected lower future prices shift supply right (increase current supply)
- •Producers may hold inventory or rush to sell
- •Examples: If sellers of gold expect the price of gold to increase, they will sell less today and wait to sell more at the higher future price.
Government Actions
Policies and regulations implemented by government that affect production costs or incentives, including taxes, subsidies, regulations, and trade policies.
- •Taxes shift supply curve left (decrease supply)
- •Subsidies shift supply curve right (increase supply)
- •Regulations can increase costs and decrease supply
- •Examples: excise taxes, production subsidies, environmental regulations
Subsidy
A government payment to producers (or consumers) that reduces production costs, encouraging increased supply.
- •Shifts the supply curve to the right (increases supply)
- •Lowers production costs for firms
- •Example: Government gives subsidy to electric car company, allowing them to produce more electric cars at each price level
Supply Curve
An upward-sloping graph showing the relationship between price and quantity supplied.
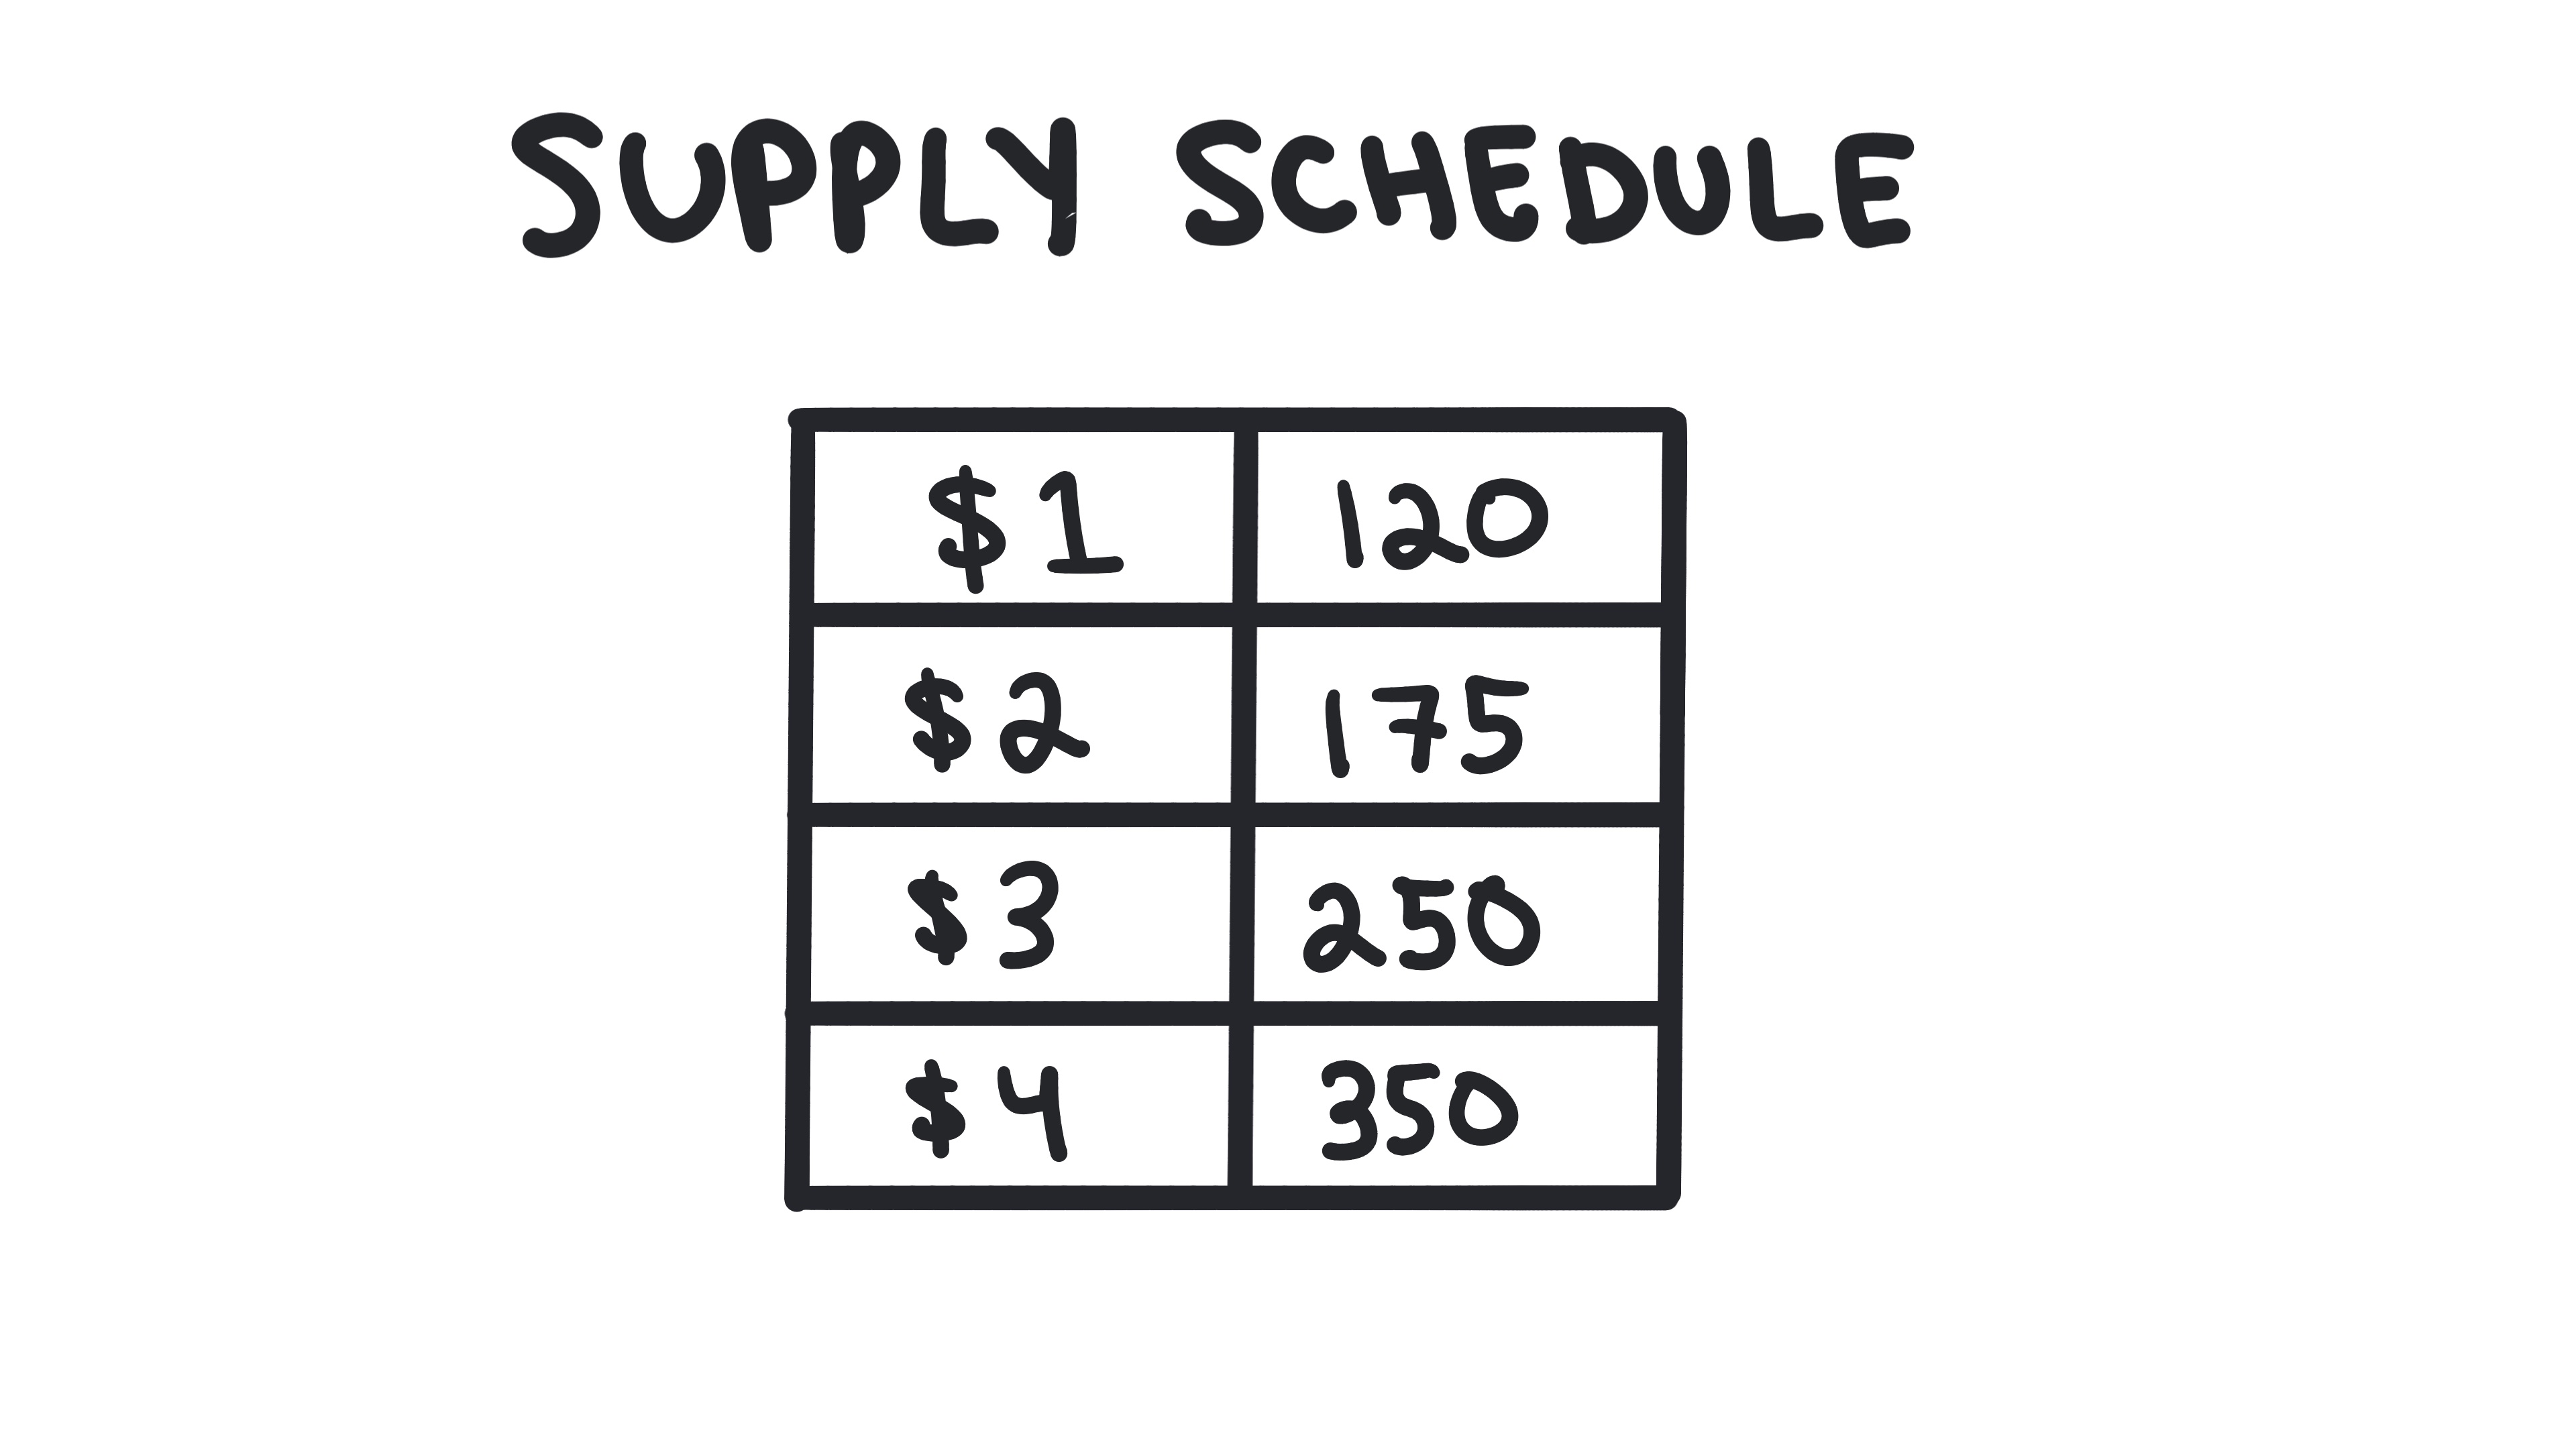
Supply Schedule
A table showing the direct relationship between the price of a good and quantity supplied.
Whiteboards
Practice MCQs
Test your understanding of 1.5
Which of the following would cause the supply curve for smartphones to shift to the right?
1.6 - Market Equilibrium, Disequilibrium, and Changes in Equilibrium
Market Equilibrium, Disequilibrium, and Changes in Equilibrium
Learn about market equilibrium, shortages and surpluses, and how shifts in supply and demand lead to changes in equilibrium.
Key Terms & Definitions
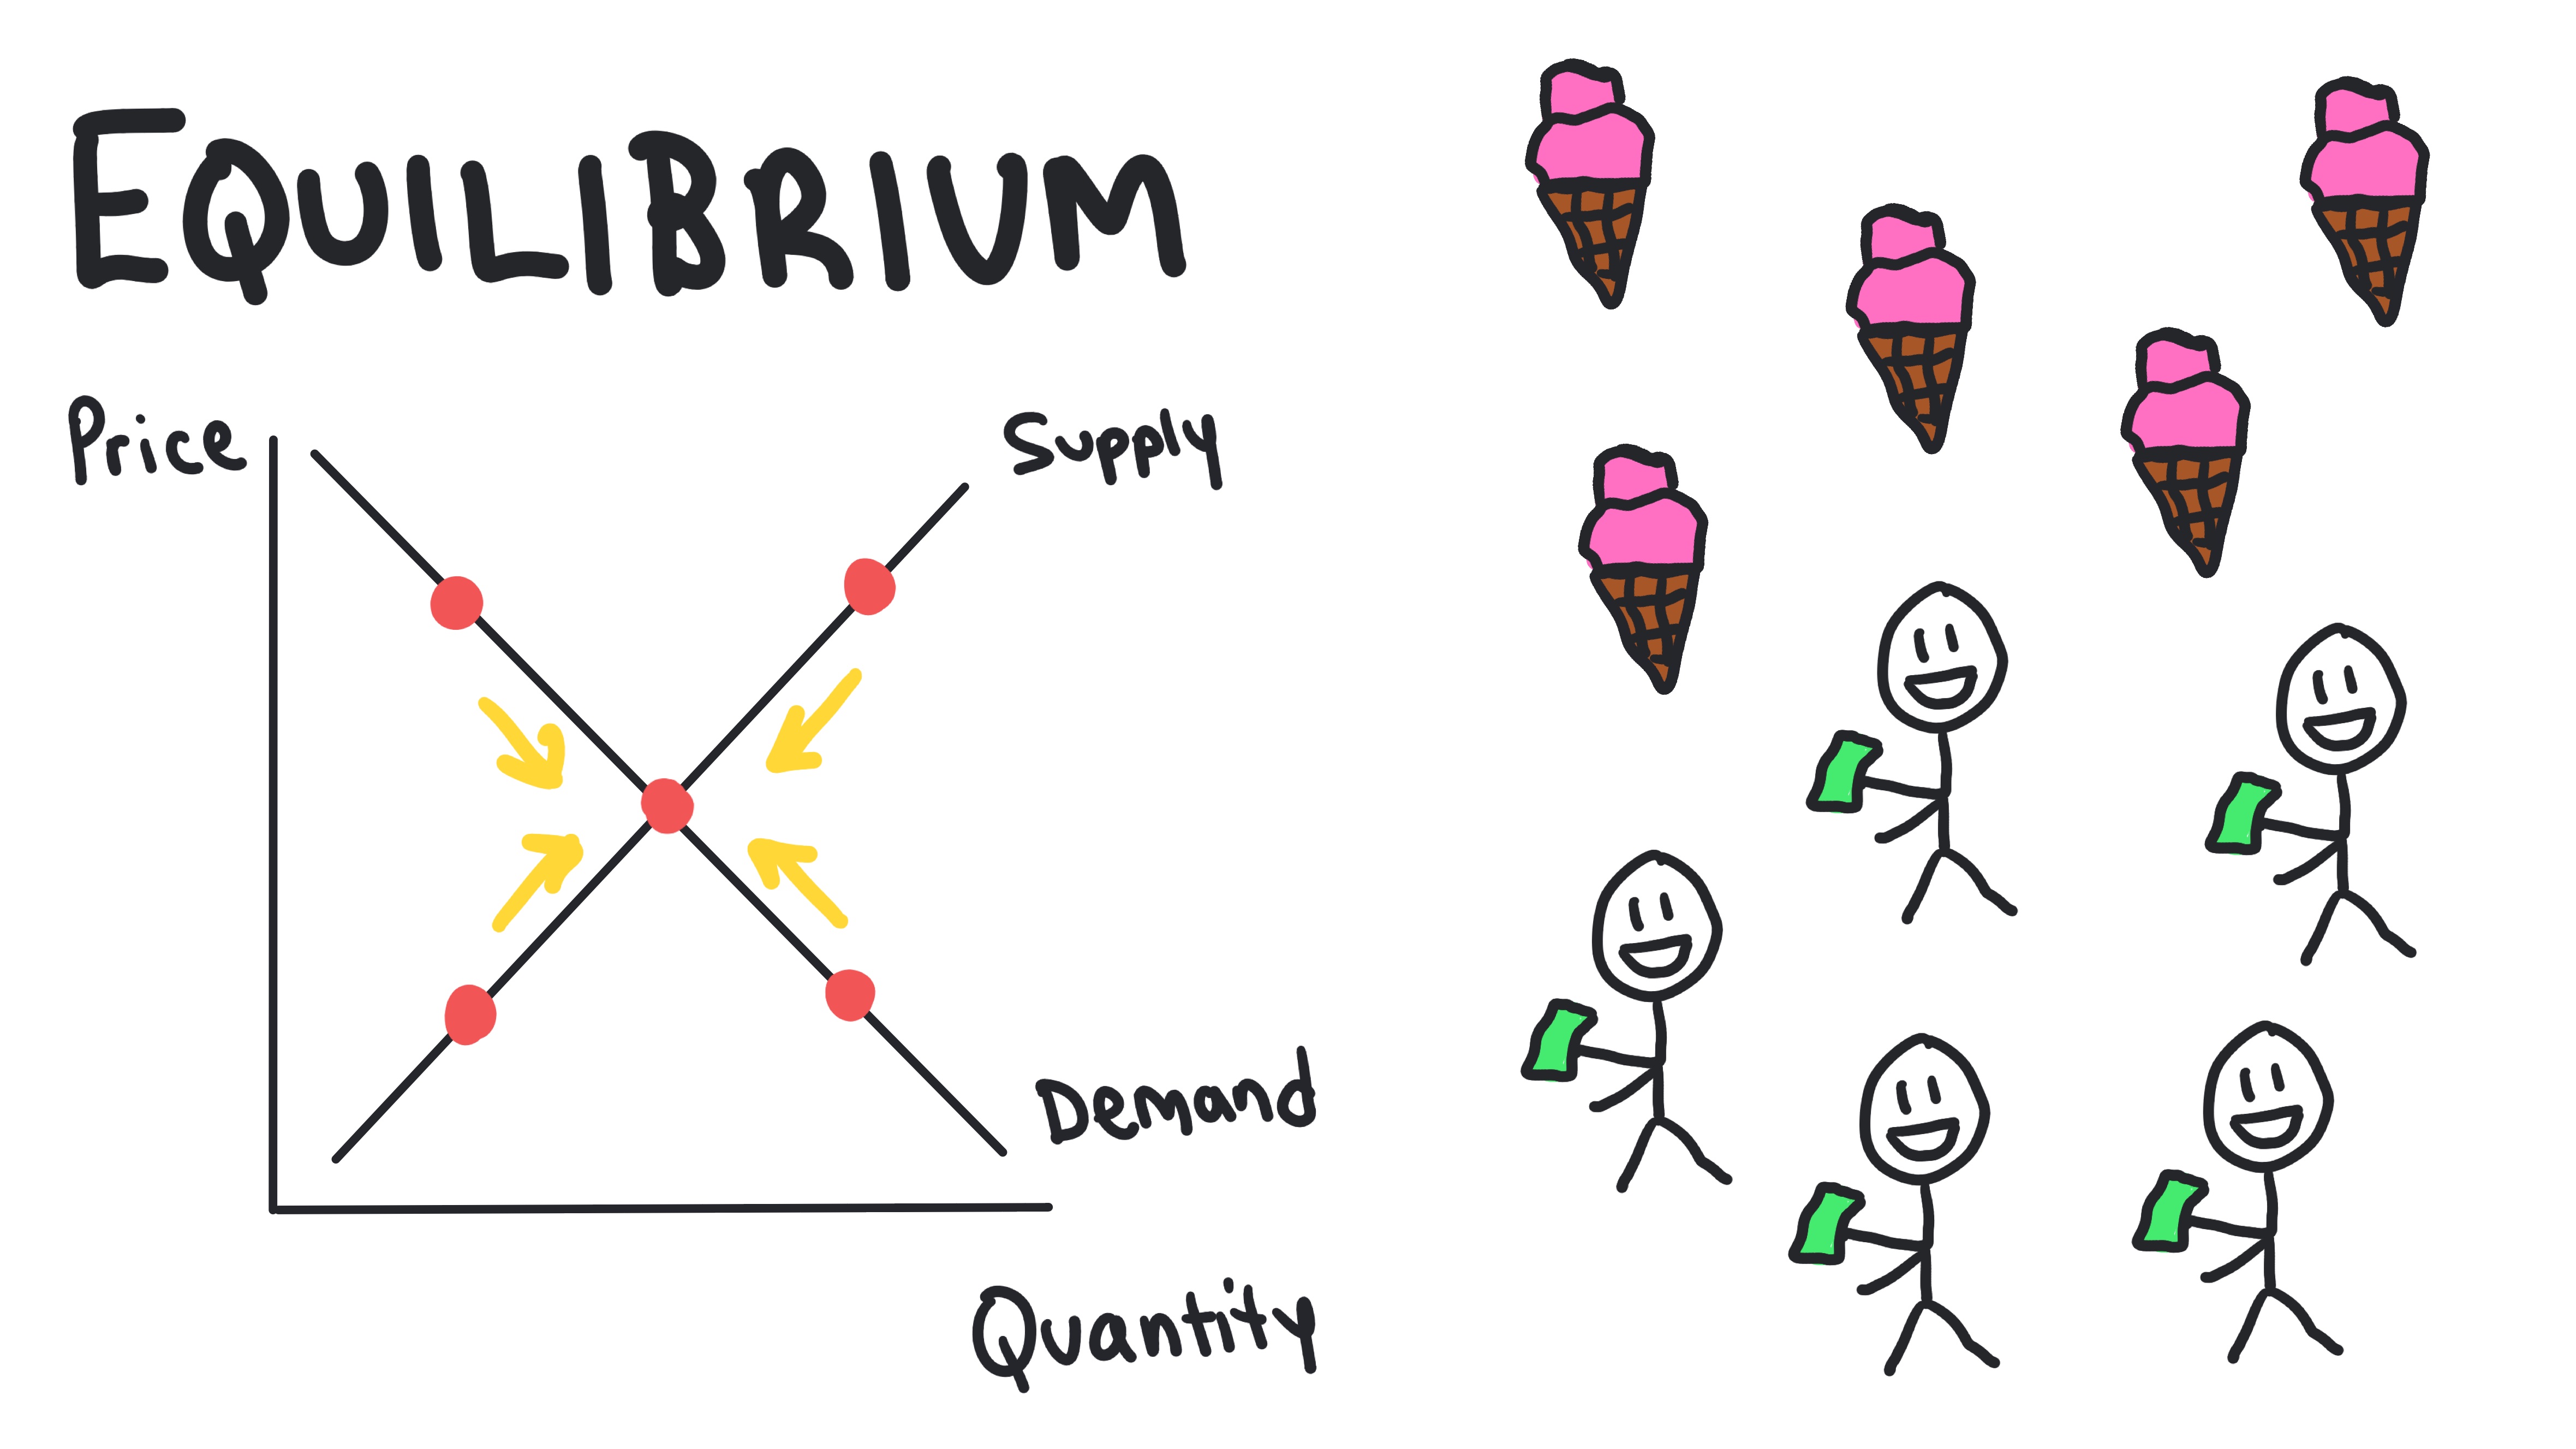
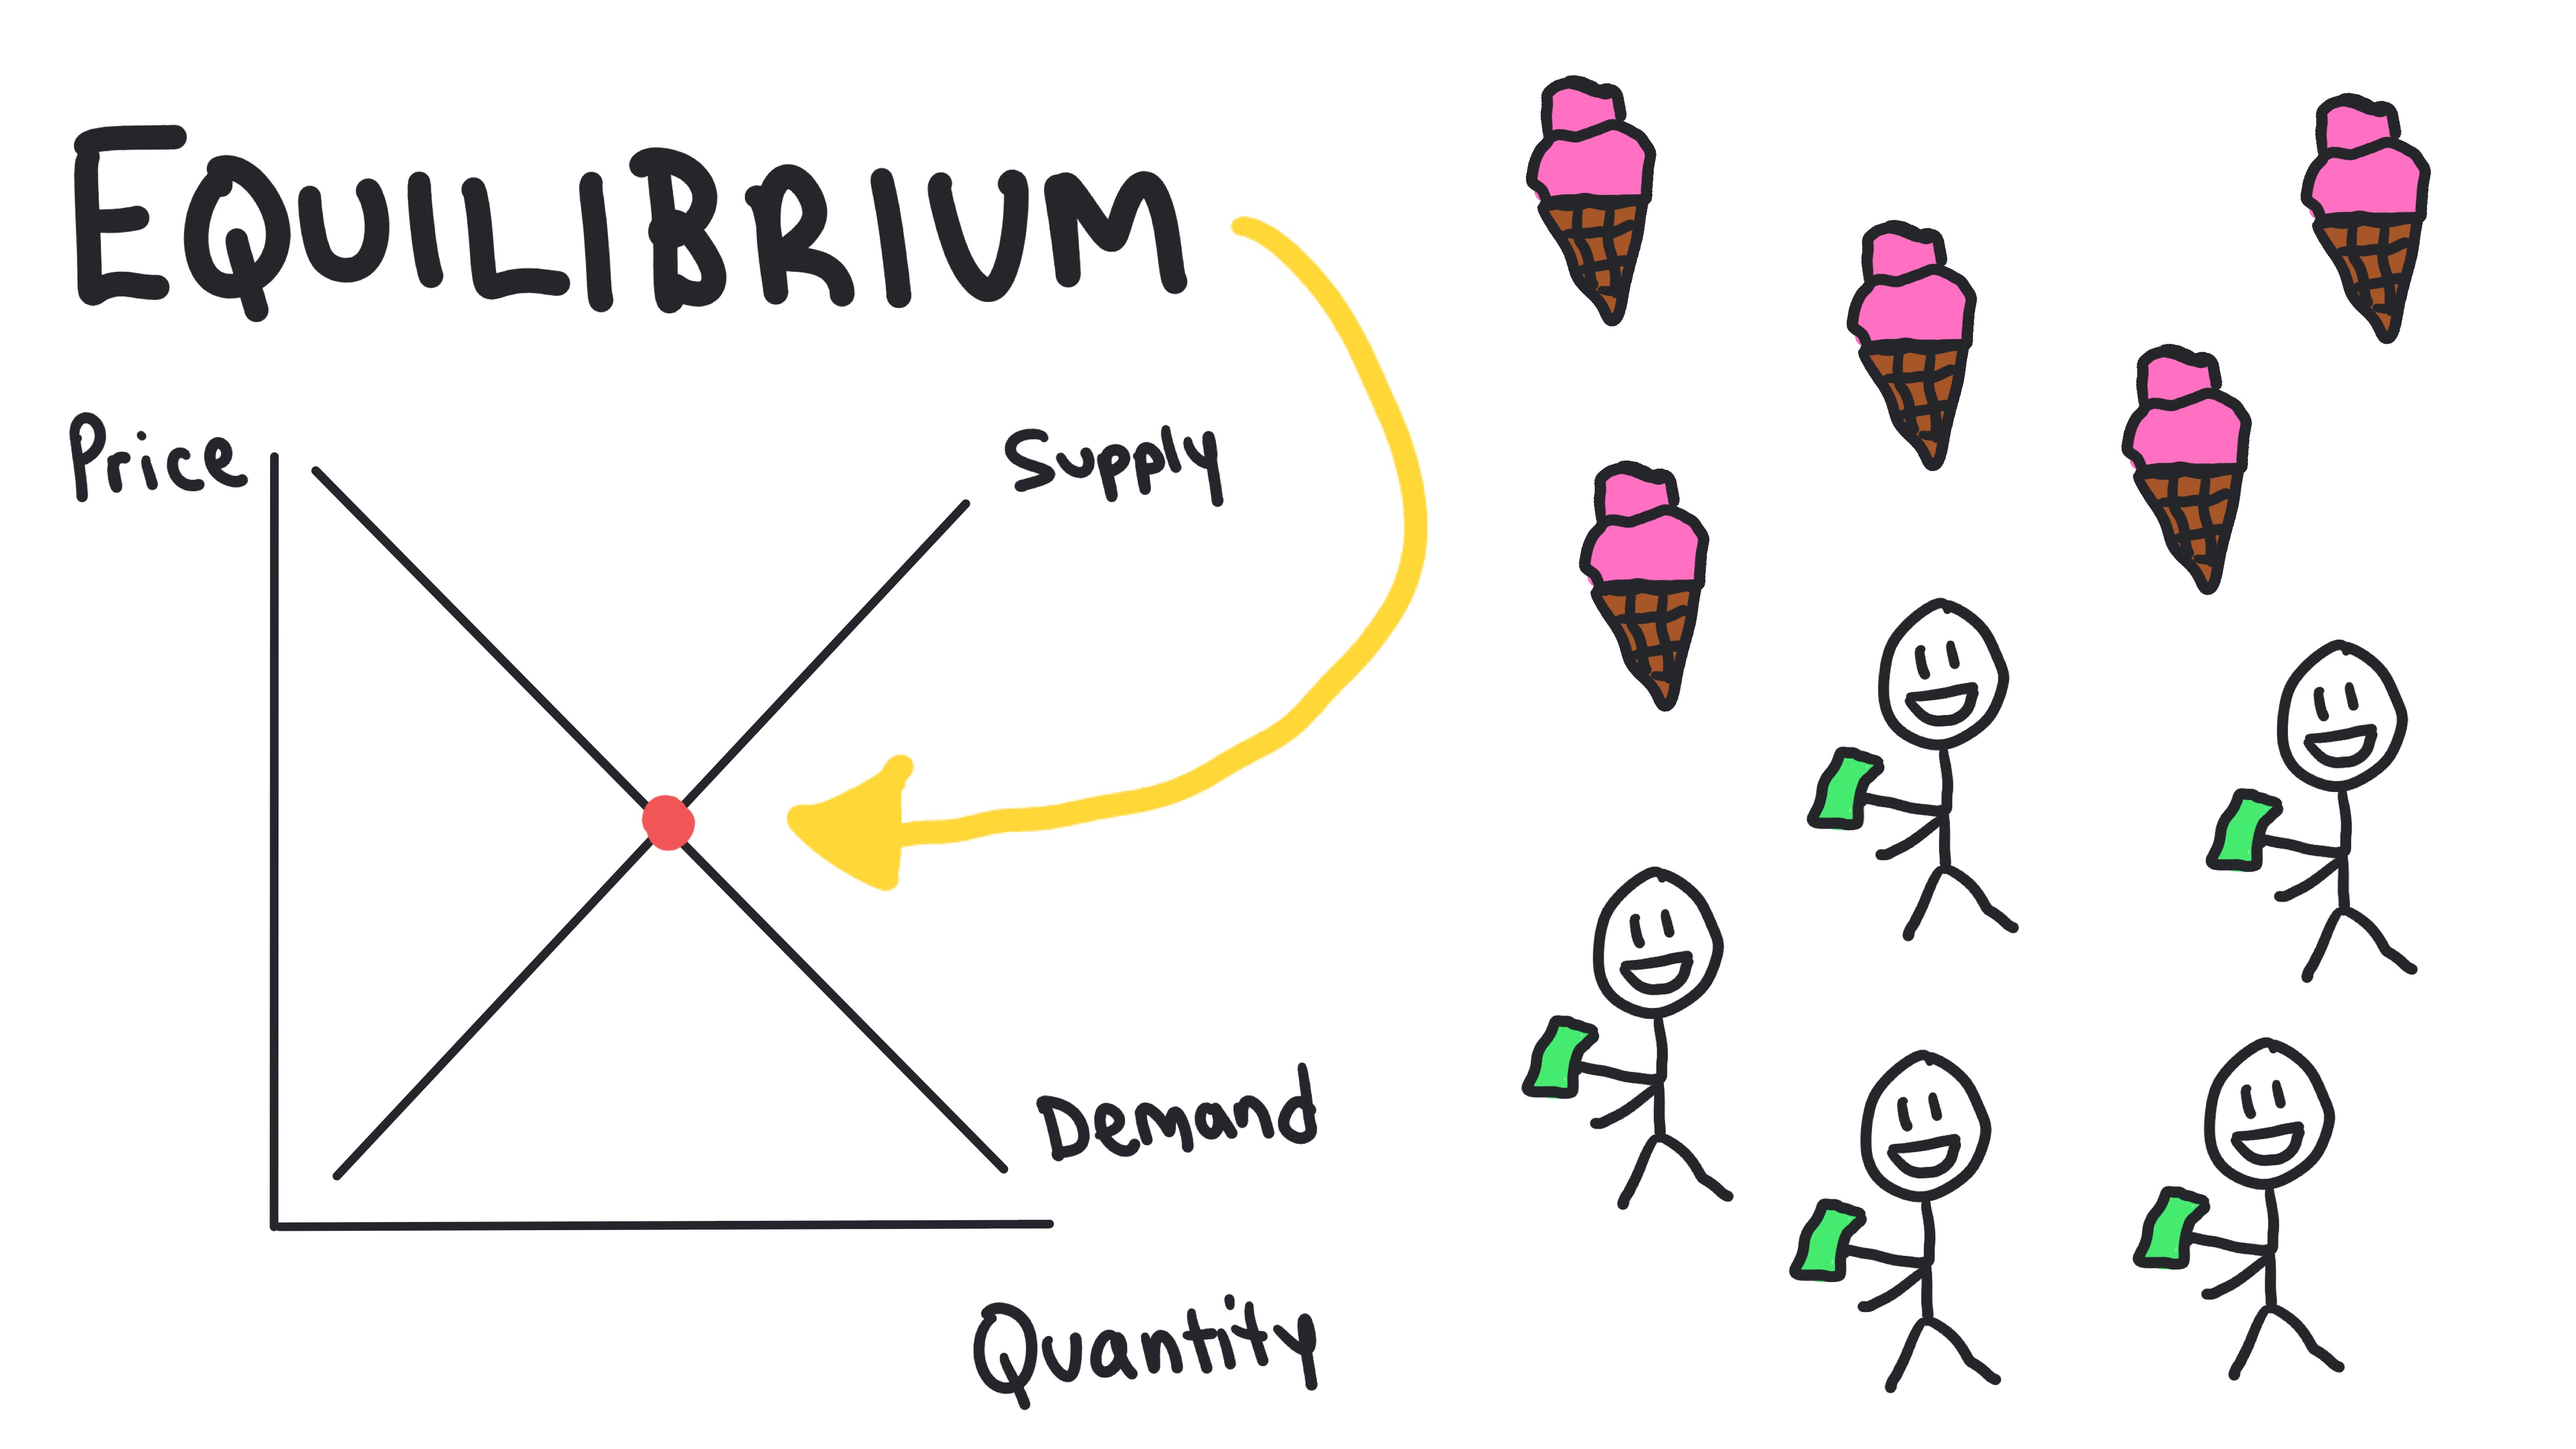
Market Equilibrium
The state where the quantity demanded equals the quantity supplied at a specific price.
- •Occurs where demand and supply curves intersect
- •No shortage or surplus at equilibrium
- •Market automatically moves toward equilibrium
Equilibrium Price
The price at which quantity demanded equals quantity supplied in a market. Also known as the market-clearing price (P* or Pe).
- •Occurs where demand and supply curves intersect
Equilibrium Quantity
The quantity of a good or service bought and sold at the equilibrium price (Q* or Qe).
- •Occurs where demand and supply curves intersect
Disequilibrium
Any time the market price is not at equilibrium, causing a surplus or shortage.
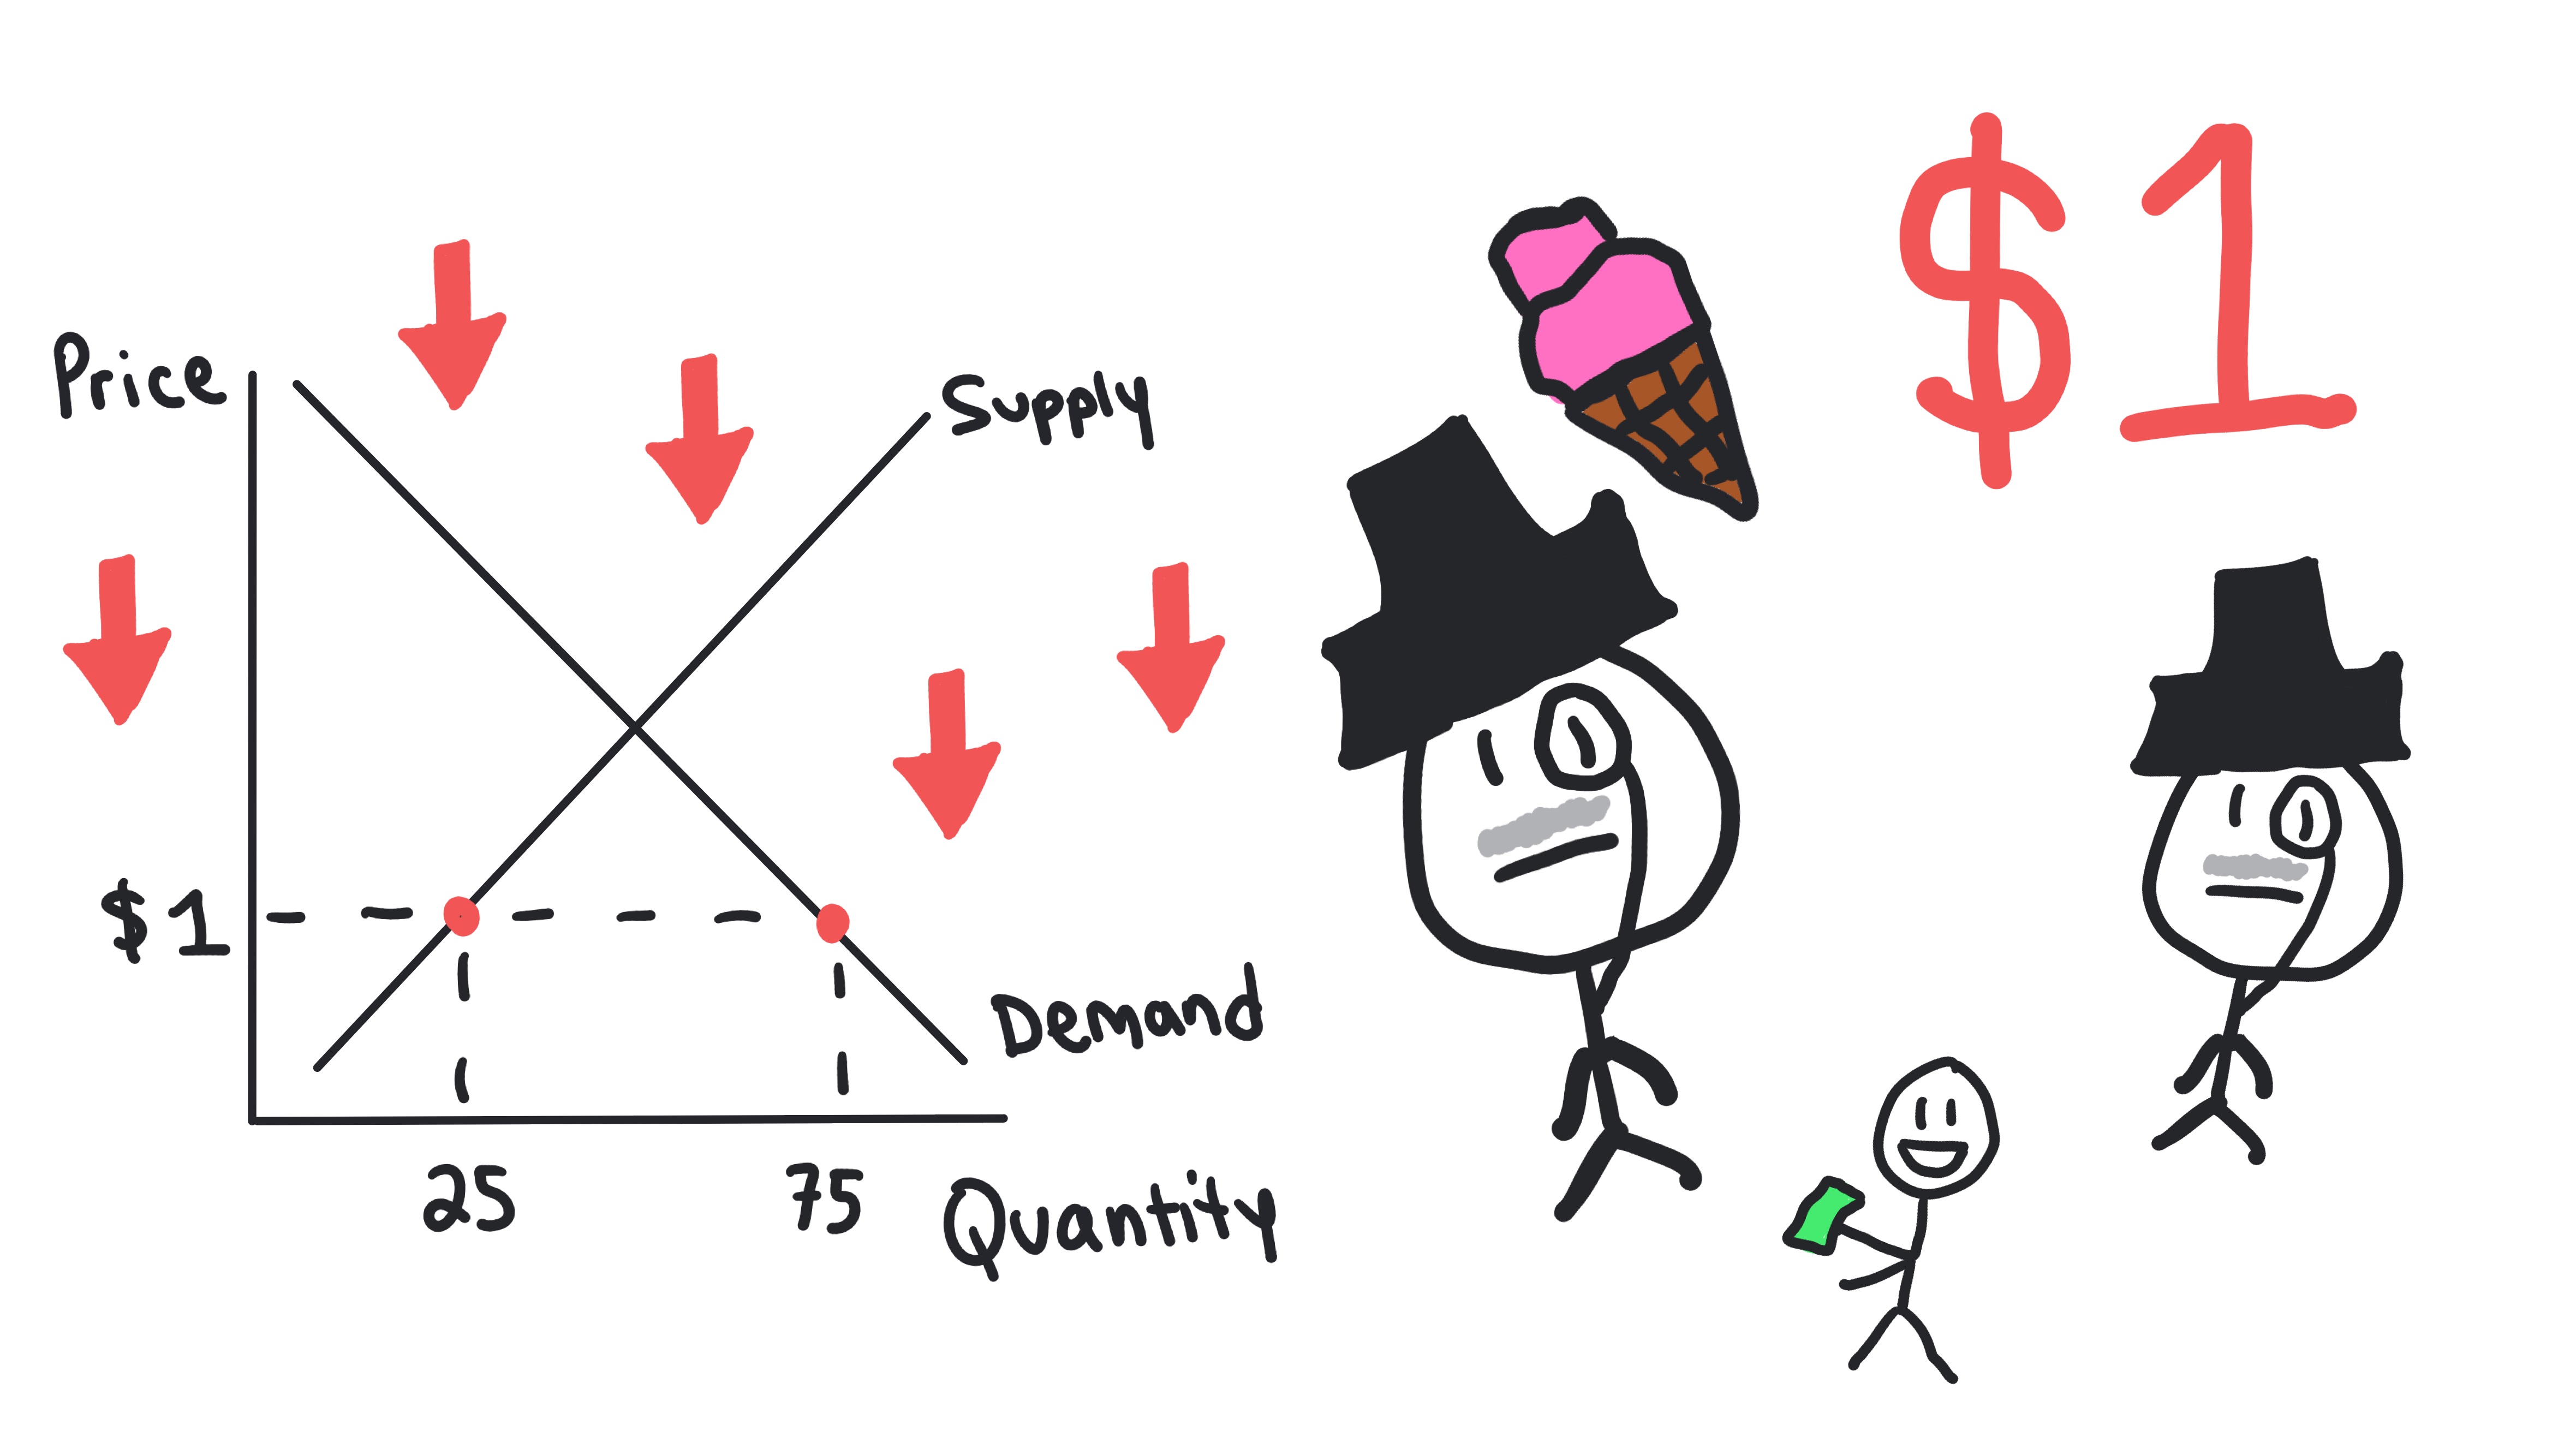
Surplus
A situation where the quantity supplied (Qs) exceeds the quantity demanded (Qd) at the current price (Qs > Qd). Occurs when the price is above equilibrium.
- •Also called excess supply
- •Creates downward pressure on price
- •Some producers cannot sell their goods
- •Market will adjust toward equilibrium
Shortage
A situation where the quantity demanded (Qd) exceeds the quantity supplied (Qs) at the current price (Qd > Qs). Occurs when the price is below equilibrium.
- •Also called excess demand
- •Creates upward pressure on price
- •Some consumers cannot buy the good
- •Market will adjust toward equilibrium
Indeterminate Change
Result of a double shift where the change in equilibrium price or quantity cannot be determined without knowing relative shift sizes.
Whiteboards
Practice MCQs
Test your understanding of 1.6
In a competitive market, equilibrium is achieved when: